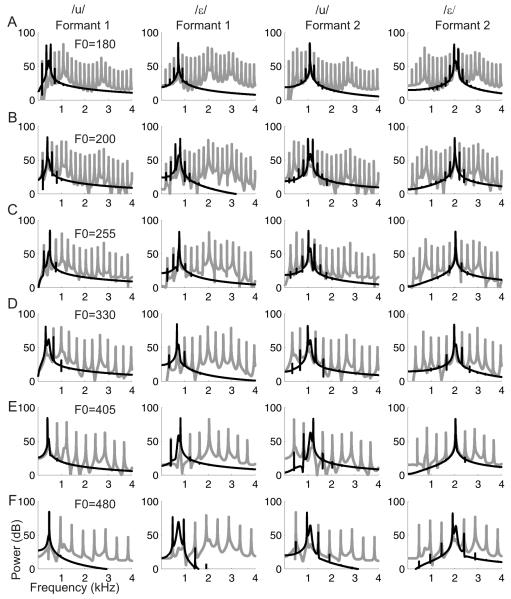
Figure 4.
Power spectra of the “single formant” vowels. Each row corresponds to a different F0, with low F0 stimuli at the top. The columns show the amplitude spectra (in black) from left to right of the first formant of /u/, the first formant of /ε/, the second formant of /u/ and the second formant of /ε/. The spectra in gray are the complete, four-formant, vowels.

