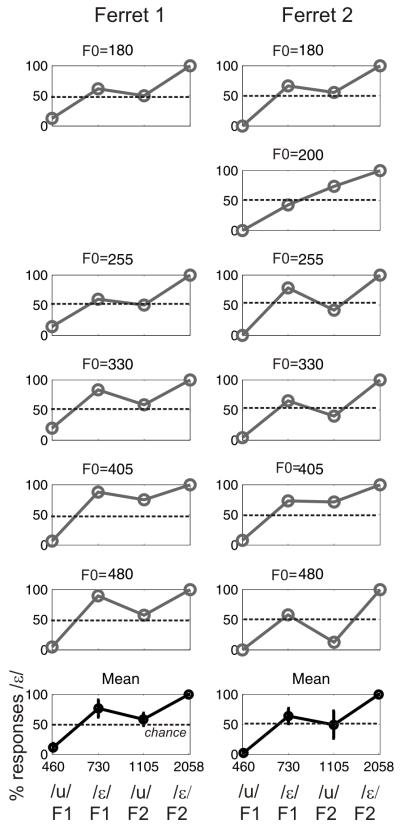
Figure 5.
Discrimination of the “single formant” vowels illustrated in Figure 4. The plots in each column show the data from two ferrets that were tested with single formant vowels with formant frequencies corresponding to either the first (F1) or second formant (F2) of the /u/ or /ε/ used in the previous experiments. (A-L) The single formant vowels were presented at different fundamental frequencies as shown above each panel (ferret 1 was not tested with an F0 of 200 Hz).

