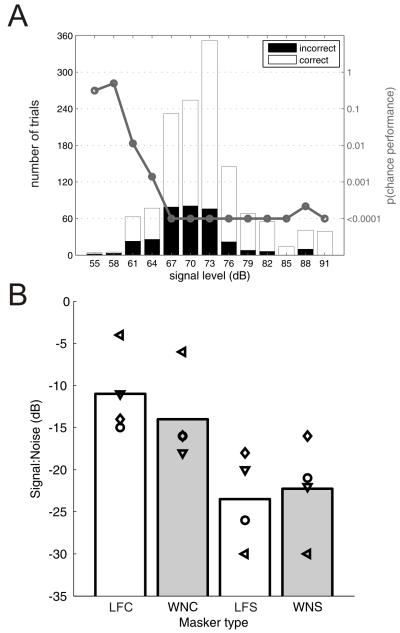
Figure 6.
Vowel discrimination in the presence of masking noise. (A) Data from Ferret #3 discriminating vowels in the presence of white noise, with the location of the vowel sound and the masking noise separated by 60°. The total number of correct responses (white bars ) and incorrect responses (black bars) are plotted at each signal level. Overlaid (gray line) is the probability of the observed proportion of correct trials being the same as chance (50% performance) estimated using the binomial distribution. In this case threshold is 64 dBSPL signal level (B) Signal to noise ratio thresholds calculated in each of four listening conditions. Individual animal means are represented by the symbols and the bars show the mean of all animals. Ferrets were tested with either white noise (WN) or speech-shaped noise(Sp), which was either collocated (C) or spatially separated (S) from the target vowel.

