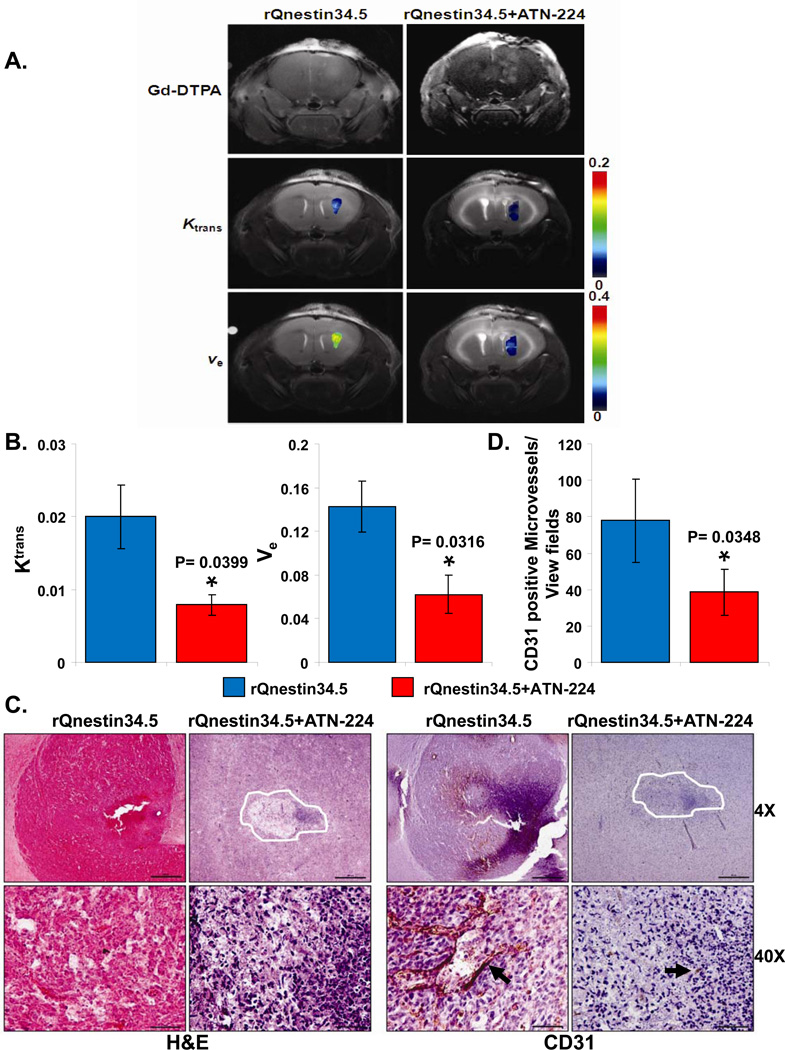
Figure 3. Changes in vascular perfusion in oHSV treated mice ± ATN-224.
A) Contrast enhanced and color coded parametric images of coronal sections of mice three days after treatment with rQnestin34.5 ± ATN-224. Top panel shows Gd enhanced image (taken immediately after Gd injection) of one representative mouse/group imaged three days post treatment with rQnestin34.5. Middle panel shows color coded parametric images of Ktrans in mice treated with rQnestin34.5 or rQNestin34.5 + ATN-224. Bottom panel shows color coded parametric images of ve in mice treated with rQnestin34.5 or rQnestin34.5 + ATN-224. A shift towards red indicates a higher value. B) Quantification of changes in Ktrans and ve in oHSV treated tumors. Data shown are mean ± SD of four different mice. C) Representative photomicrographs of tumor sections stained with Hematoxylin and Eosin (H&E) and anti-CD31 antibody highlighting endothelial cells. D) Quantification of mean microvessel density of tumors shown in C. *: P < 0.05 compared to rQnestin34.5 treated tumors.

