
Table 2.
Distribution of individual HR-HPV genotype according to age groups
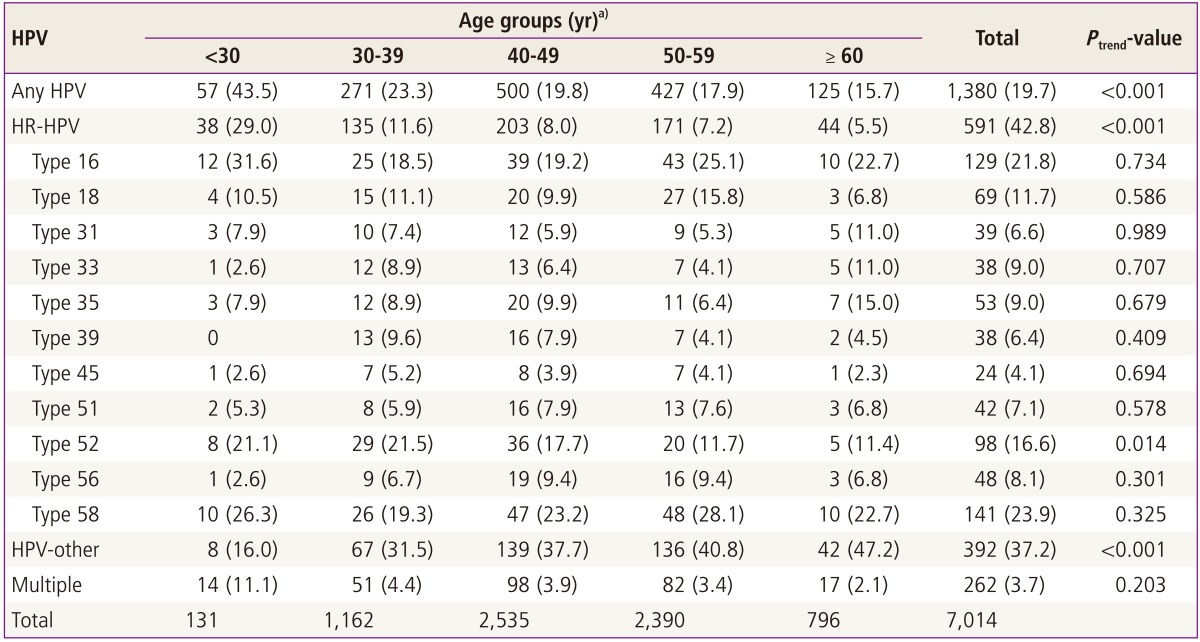
Values are presented as number of cases (%).
HR-HPV, high risk-human papillomavirus; HPV-other, unspecified HPV genotype.
a)Data are number of cases and % representing the proportion of individual HPV genotypes among all high risk-HPV positive women unless otherwise specified.