
Figure 1.
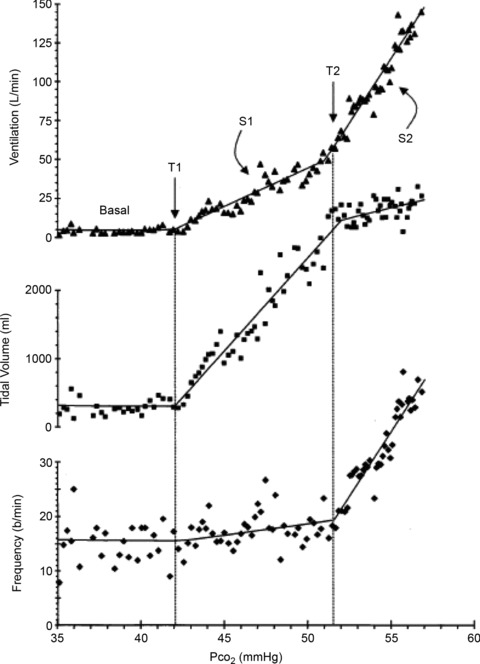
Breath-by breath measurements of ventilation, tidal volume and frequency obtained during a Duffin modified rebreathing test at an isoxic  = 40 mmHg from Duffin et al. (2000). T1 is the ventilatory recruitment threshold and T2 a patterning threshold. Although the ventilatory response might be fitted with a parabola indicating a hyperadditive interaction, the tidal volume and frequency measurements show that division into two linear segments is appropriate