
Figure 2. Glycogen content in three subcellular localizations in muscle before and after approximately 1 h of exhaustive exercise.
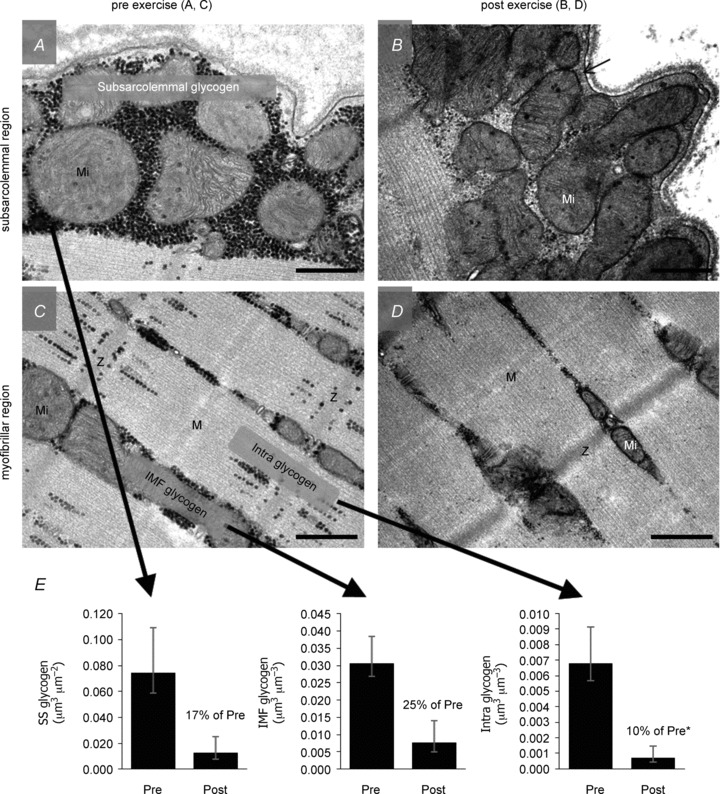
A–D, overview showing the typical localization pattern of glycogen particles in the subsarcolemmal region (A, B) and the myofibrillar region (C, D) of a muscle fibre, pre (A, C) and post (B, D) approximately 1 h of exhaustive exercise. Representative images originate from an arm (m. triceps brachii) type I fibre from trained subjects. Glycogen particles are visualized as black dots, with the intermyofibrillar (IMF) glycogen located between the myofibrils and the intramyofibrillar (Intra) glycogen within the myofibrils, mainly located in the I-band. Subsarcolemmal (SS) glycogen is located between the sarcolemma and the outermost myofibril. E, geometric mean glycogen content in the three localizations, with a significantly higher relative utilization of the Intra glycogen (5–15% of total glycogen) during the exercise compared to SS and IMF glycogen (5–15 and 75% of total glycogen, respectively). Mi, mitochondria; Z, Z-line; M, M-band. Scale bars = 0.5 μm. Original ×40,000 magnification. Adapted from Fig. 4 of Nielsen et al. (2011).