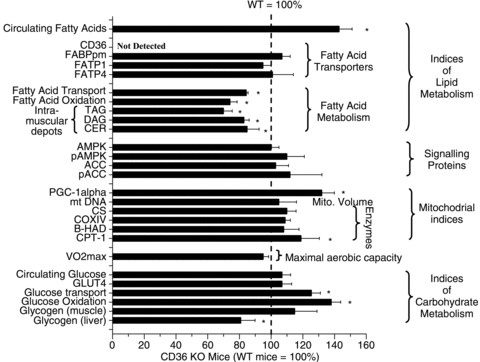
Figure 4. Phenotype of CD36 KO mice compared to WT mice (100%, see dashed line).

Data are means ± SEM. *P < 0.05, CD36 KO vs. WT. From McFarlan et al. (2012). © American Society for Biochemistry and Molecular Biology.

Data are means ± SEM. *P < 0.05, CD36 KO vs. WT. From McFarlan et al. (2012). © American Society for Biochemistry and Molecular Biology.