
Figure 4. Responses of Mermaid2 in HEK293 cells.
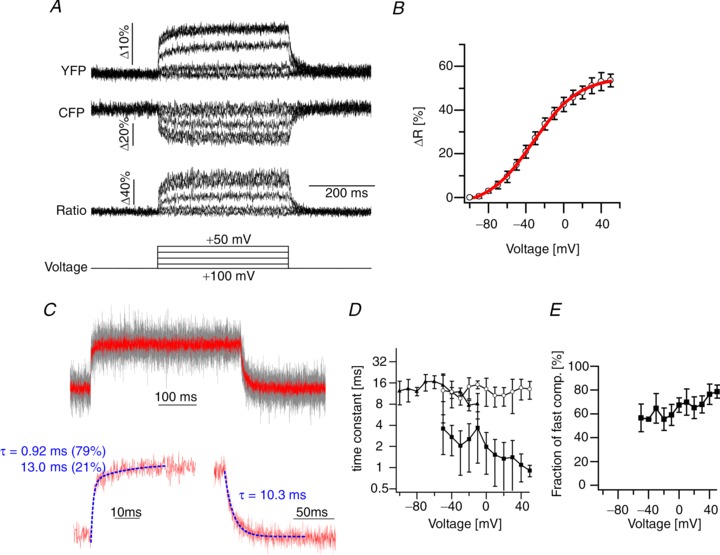
A, representative YFP and CFP signals as well as their ratio (YFP/CFP) elicited by voltage steps in HEK293 cells (∼33°C). Responses in single trials in a single voltage-clamped cell are shown. Data were low-pass filtered at 0.7 kHz. B, steady-state ratio response versus membrane voltage in HEK293 cells (open circles, n= 5; continuous line, Boltzmann's function fit, Vmid=−32 mV, the effective charge valence (Zd) = 1.05). C, top traces show superimposed normalized YFP signals from 5 different cells (in grey) and their average in response to the voltage step from −100 mV to +50 mV. Note that data were not filtered offline to perform the kinetic analysis. Examples of fits for the on- and off-responses with double and single exponential functions are shown at the bottom. D, voltage dependence of the time constants for activation (fast component, filled squares; slow component, open circles; n= 5 cells) and deactivation (filled triangles; n= 5 cells). Notably, a sub-millisecond activation time constant was obtained in HEK cells at +50 mV (0.93 ± 0.21 ms). E, fraction of the fast component for the activation time constants plotted as a function of voltage (n= 5 cells).