
Figure 1. Methodology for the identification of individual IC neurons.
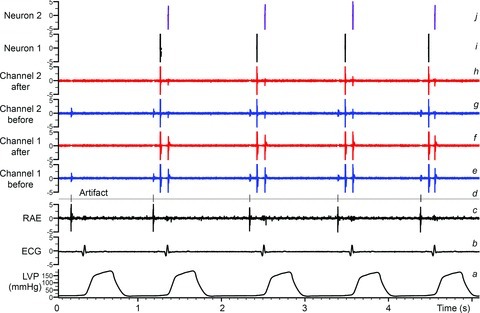
Traces indicate: a, left ventricular chamber pressure (LVP); b, electrocardiogram (ECG); c, right atrial electrogram (RAE); d, event channel created from identified electrical/mechanical artifacts; e and g, raw signal recordings of two channels from the multichannel linear microarray electrode; f and h, neuronal recordings from channels e and g after artifact removal based on the event channel d; i and j, two final neuronal waveforms extracted from a stereotrode built from channels f and h using principal component analysis. These final waveforms (i and j) represent basal activity from two separate IC neurons located within the right atrial ganglionated plexus; such activity can be evaluated continuously and concurrently for hours and in response to imposed stressors.