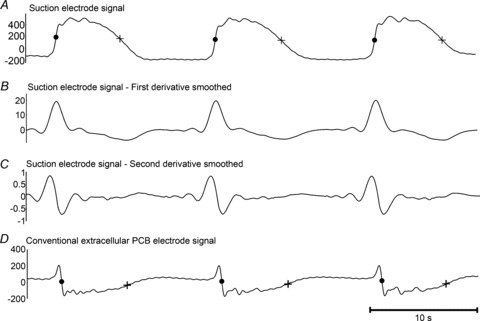
Figure 4. Gastric extracellular slow wave potentials.

A, a monophasic electrode signal recorded experimentally by the suction electrode (Fig. 1A) with activation and recovery times marked by a dot • and +, respectively. B and C, the first and second derivative of the monophasic suction electrode signal of the monophasic suction electrode signal. D, the biphasic electrode signal was recorded experimentally by a conventional serosal contact electrode (Fig. 1B) with the activation and recovery times marked by a dot • and +, respectively. The activation–recovery interval was consistent between the biphasic and monophasic waveforms (refer Table 2). The biphasic signal demonstrated a morphology that was consistent with the smoothed second derivative of the monophasic suction electrode (C).
