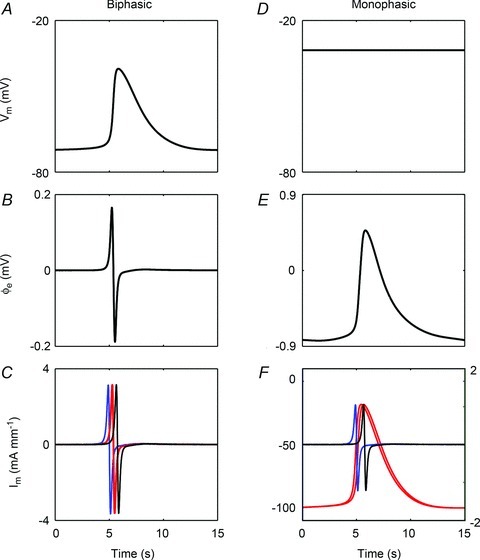
Figure 5. Gastric slow wave extracellular potentials simulated in the model outlined in Fig. 2.

Left column: biphasic potential (conventional serosal contact electrode); right column: monophasic potential (suction electrode). A, simulated membrane potential sampled at x= 4.5 mm along the fibre; B, simulated extracellular potential at 2.66 mm away from the fibre; C, Im sampled at four points at x= 1.5 (blue), 4.35 (red), 4.65 (red), and 7.5 mm (black). The two traces shown in red are nearest to the electrode and are nearly identical in time. D, simulated membrane potential sampled at x = 4.5 mm along the fibre. To simulate suction pressure, the membrane potential was held at −32 mV; E, simulated extracellular potential; F, Im sampled at four points at x= 1.5 (blue), 3.9 (red), 5.1 (red), and 7.5 mm (black). The two traces shown in red are nearest to the electrode and are nearly identical in time. The left axis correlates to the monophasic red traces, and the right axis correlates to the biphasic blue and black traces. The morphologies of the modelled biphasic and monophasic potentials were concordant with the experimental data obtained using these techniques (Figs 1 and 4).
