
Fig. 2.
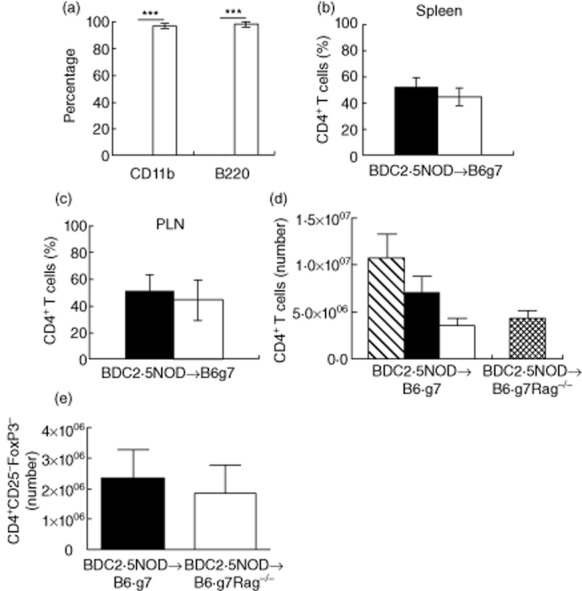
Emergence of host-derived CD4+ T cells in the reconstituted B6.g7 mice. (a) Spleen cells from BDC2·5non-obese diabetic (BDC2·5NOD)→B6.g7 mice at week 12 post-transplant were stained for CD11b (myeloid cells) and B220 (B cells) and analysed to determine host (CD45·2+; black bar) or donor (CD45·1+; white bar) origin by flow cytometry. (b) Frequency of host (black bar) and donor-derived (white bar) splenic CD4+ T cells. (c) Frequency of host (black bar) and donor-derived cells (white bar) in the draining lymph node. The histograms (a,b,c) depict mean percentage of host and donor-CD4+ T cells ± standard error of the mean (s.e.m.) from three animals. ***P < 0·0001 (t-test). Data are representative of two experiments. (d) Absolute numbers of host- and donor-derived splenic CD4+ T cells. Splenocytes from BDC2·5NOD→B6.g7 mice and BDC2·5NOD→B6.g7Rag–/– mice at 6 weeks post-haematopoietic cell transplantation (HCT) were stained for CD4 and CD45·2 (host) or CD45·1 (donor). Absolute numbers were determined by multiplying the total number of cells in each spleen (determined using a Coulter counter) by the percentage of the host and donor-derived CD4+ T cells. The histogram in (d) depicts mean number (± s.e.m., n = 5) of the total CD4+ T cells (striped bar), host-derived (black bar) and donor-derived (white bar) CD4+ T cells in the BDC2·5NOD→B6.g7 mice, and the total number of donor-derived CD4+ T cells (netted bar) in the BDC2·5NOD→B6.g7Rag–/–. The histogram in (e) depicts mean number (± standard error of the mean, n = 5) of the donor-derived CD4+CD25–forkhead box protein 3 (FoxP3)– T cells in the BDC2·5NOD→B6.g7 mice (black bar) and BDC2·5NOD→B6.g7Rag–/– (white bar). Data are pooled from two experiments.