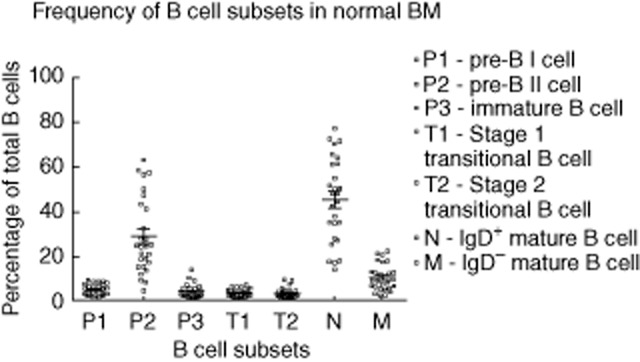
Fig. 2.

Enumeration of B cell subsets in normal bone marrow (BM). The mean [± standard error of the mean (s.e.m.)] frequencies of various B cell subsets in the normal BM are presented in this chart (n = 27). The means (± s.e.m.) of each subset are as follows: pre-B I (4·7 ± 0·5%), pre-B II (28·7 ± 3·3%), immature (4 ± 0·6%), T1 (3·2 ± 0·3%), T2 (3·1 ± 0·4%), IgD+ mature B cells (naive and natural effector) (45·2 ± 3·6%) and IgD– mature B cells (IgM only, and switched memory) (10·2 ± 1·1%).
