Fig. 6.

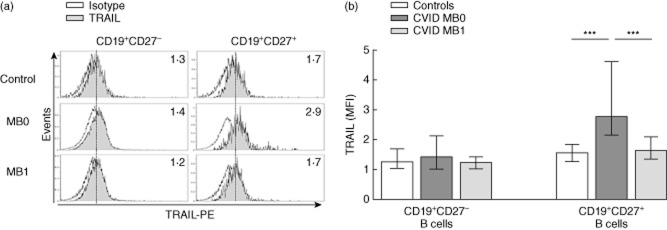
Tumour necrosis factor (TNF)-related apoptosis-inducing ligand (TRAIL) surface expression on peripheral blood B cells from common variable immunodeficiency (CVID) patients and healthy controls. (a) Representative histograms of TRAIL expression (grey) on CD19+CD27– (left columns) and CD19+CD27+ (right columns) B cells from a healthy control (upper row), one CVID MB0 (middle row) and one CVID MB1 (lower row) patients. Numbers indicate TRAIL median fluorescence intensity (MFI) evaluated on a 3-decade log scale. (b) TRAIL MFI of CD19+CD27– and CD19+CD27+ B cells from healthy controls (n = 18; white bars), CVID MB0 (n = 9; dark grey bars) and MB1 (n = 6; light grey bars) patients. Data are given as median and 25th to 75th percentiles (Kruskal–Wallis test P-values: P < 0·001***).
