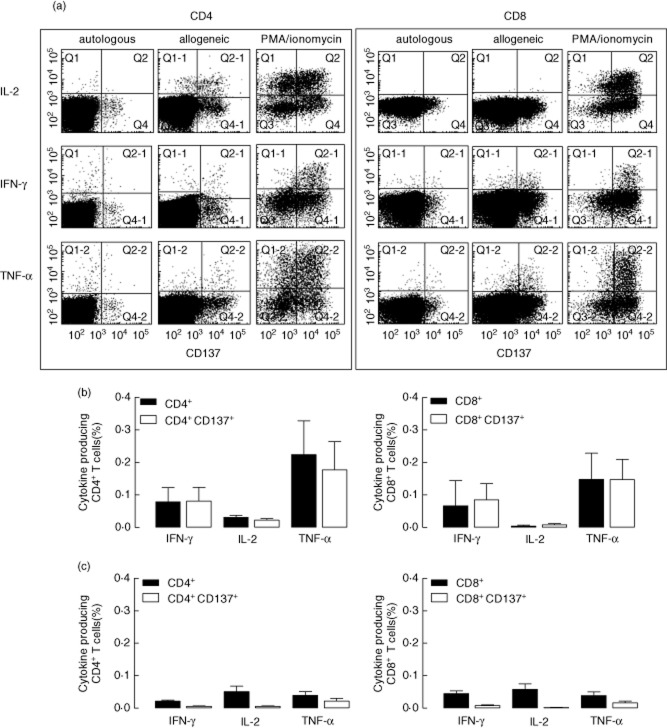
Fig. 2.
Cytokine-producing T cells upon alloantigen stimulation and CD137 expression. A typical flow cytometric example of the analysis of autologous, allogeneic and polyclonal induction of cytokine producing CD4+ (left panel) and CD8+ (right panel) T cells is given in (a), with CD137 expression on the x-axis and different cytokines on the y-axis. Mean ± standard error of the mean (s.e.m.) (n = 8) cytokine-producing cells upon allogeneic stimulation (corrected for autologous background) are displayed as percentage of total CD4+ (b, left graph, closed bars) and CD8+ (b, right graph, closed bars) T cells, respectively, or as a percentage of CD4+CD137+ (b, left graph, open bars) and CD8+CD137+ (b, right graph, open bars), respectively. Background cytokine-producing CD4+ (c, left graph) or CD8+ (c, right graph) T cells induced by autologous stimulation are depicted as percentage (mean ± s.e.m.) of total CD4+ or CD8+ T cells (closed bars) or as a percentage of CD137+CD4+ or CD8+ T cells (open bars).

