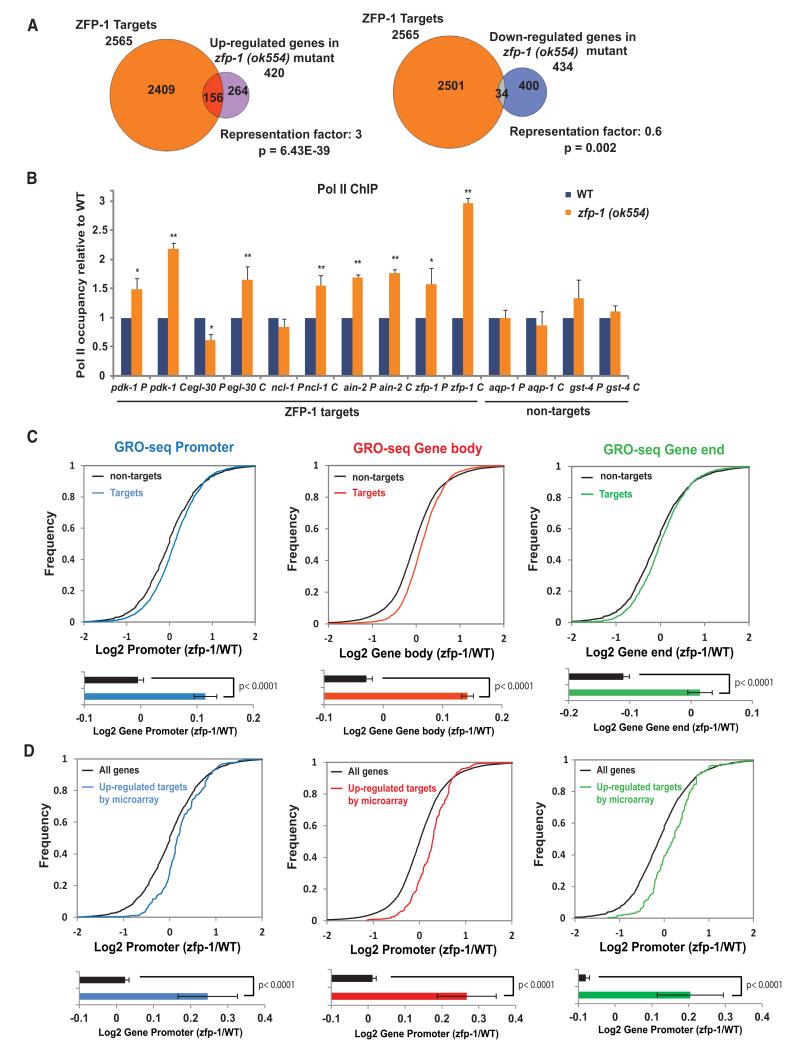
Figure 2. ZFP-1 and DOT-1.1 Inhibit Transcription.
(A) Venn diagrams demonstrating an enrichment of ZFP-1 ChIP-chip targets among genes expressed at a higher level in the zfp-1(ok554) mutant larvae, but not among genes expressed at a lower level (Grishok et al., 2008). A Fisher’s exact test was used for calculating p values for overlaps.
(B) Pol II occupancy analysis on ZFP-1 target genes and control nontarget genes by ChIP-qPCR in WT and zfp-1(ok554) mutant L3 larvae. The results of three independent experiments are shown. Error bars represent SD. * indicates a significance of p < 0.05, and ** indicates p < 0.01 in comparison WT larvae according to a Student’s t test.
(C) Top, cumulative distribution plots of GRO-seq data presented as in Core et al., 2012, and showing the overall effect of zfp-1(ok554) mutation on polymerase density at ZFP-1 target (colored lines) and nontarget genes (black lines). The transcriptome was divided into promoters (−600 bp TSSs, +200 bp TSSs), gene bodies (+200 bp TSSs, −200 bp TTSs), or gene ends (−200 bp TTSs, +400 bp TTSs). Bottom, the average of the log2 ratio between zfp-1(ok554) and WT normalized reads for promoter, gene body, and gene end. Error bars represent a 95% confidence interval for the mean. Two-tailed p values show the statistical significance of difference between ZFP-1 target (colored bars) and nontarget (black bars) means.
(D) GRO-seq analysis performed as in (C) considering the 156 ZFP-1 target genes found upregulated in zfp-1(ok554) by microarray versus all genes. See also Figure S4 and S5.

