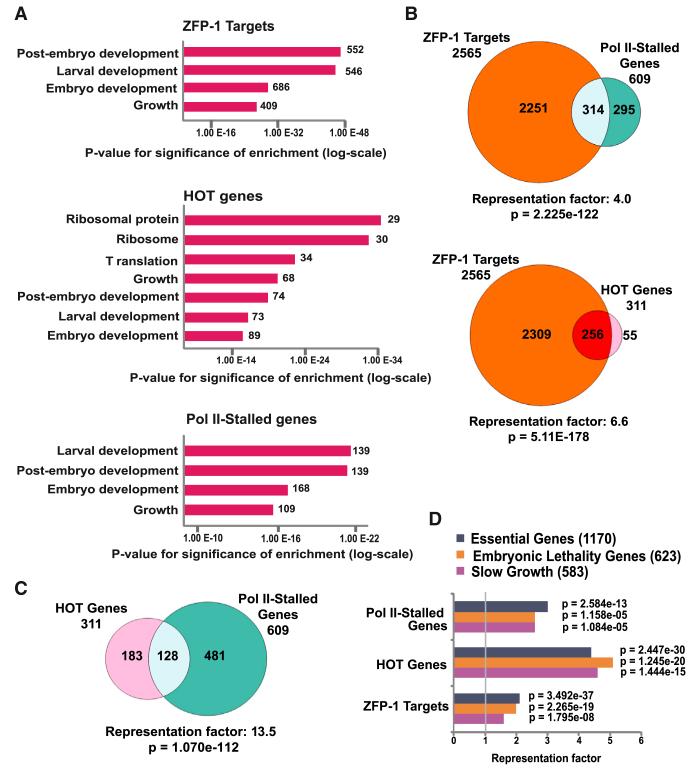
Figure 3. ZFP-1/DOT-1.1 Targets Represent Essential Developmental Genes that Overlap with Previously Described Genes with Stalled Pol II and High-Occupancy Target Genes.
(A) Gene Ontology analysis of ZFP-1 targets, HOT genes (Gerstein et al., 2010), and genes with stalled Pol II (Zhong et al., 2010). Data sets listing Pol II stalling in the embryo and in the L1 (see Table S2) were combined for statistical analyses. The top enriched functional categories are shown. See Table S3 for complete functional enrichment analysis.
(B) Venn diagrams showing overlaps between ZFP-1 targets and (1) genes with Pol II stalling (top) or (2) HOT genes (bottom).
(C) Venn diagram demonstrating an overlap between HOT genes and genes with stalled Pol II.
(D) Statistical analysis showing the enrichment of Pol II-stalled genes, HOT genes, and ZFP-1 targets among essential gene sets identified by genome-wide RNAi (Kamath et al., 2003). Fisher’s exact test was used for calculating p values.

