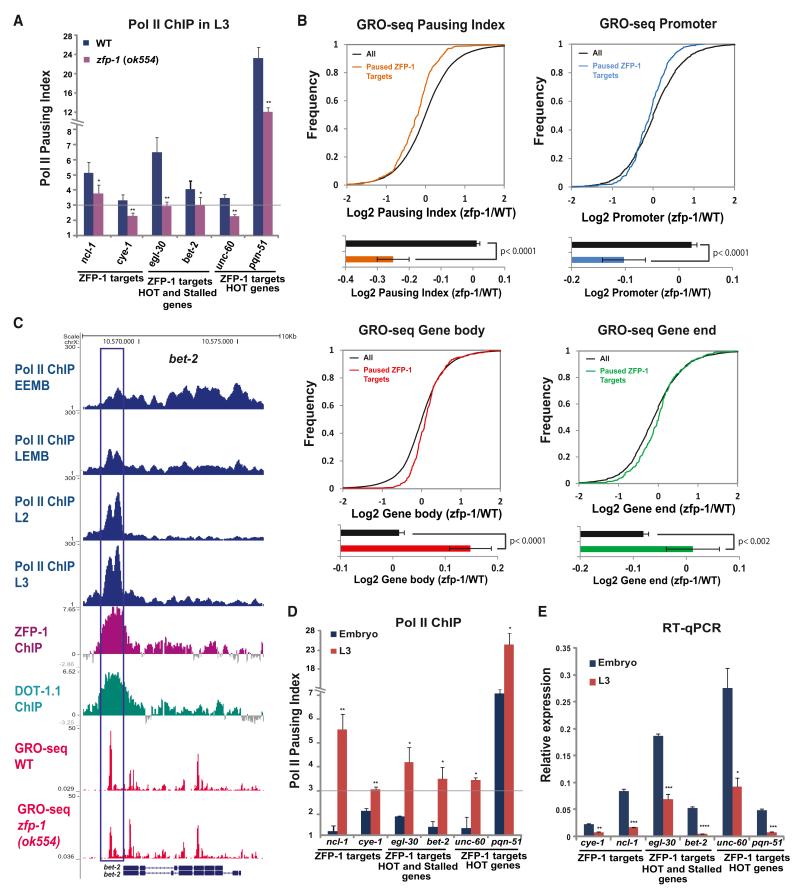
Figure 4. Increased Pausing of Pol II Is Accompanied by a Decrease in Gene Expression of ZFP-1/DOT-1.1 Targets during Development.
(A) Pol II pausing index, as measured by the ratio of Pol II ChIP-qPCR signals at the promoter and coding region, at ZFP-1 target genes in WT larvae and zfp-1(ok554). A 3-fold increase in the Pol II promoter occupancy in comparison to the coding region was considered to be the lower threshold of Pol II pausing. Some genes shown were previously annotated as Pol II stalled (Zhong et al., 2010) and/or HOT (Gerstein et al., 2010). The results of three independent experiments are shown. Error bars represent SD. * indicates a significance of p < 0.05, and ** indicates p < 0.01 in comparison to WT larvae.
(B) Top, cumulative distribution plots of GRO-seq data (as in Figures 2C and 2D) showing the effect of the zfp-1(ok554) mutation on 331 ZFP-1 target genes with paused Pol II. Bottom, the average of the log2 ratio between zfp-1 (ok554) and WT normalized reads for pausing index, promoter, gene body, and gene end. Error bars represent a 95% confidence interval for the mean. The two-tailed p value indicates the statistical significance of the difference in means between paused ZFP-1 target genes (colored bars) and all genes (black bars).
(C) An example of gene with progressive pausing of Pol II during development. Top four tracks: Pol II occupancy in early embryos (EEMB), late embryos (LEMB), and L2 larva and L3 larva (based on the Pol II ChIP-seq data available from modENCODE). Other tacks show DOT-1.1 and ZFP-1 binding identified by ChIP-chip (modENCODE) and GRO-seq normalized reads in WT and zfp-1(ok554). Gene models are based on the University of California, Santa Cruz, Genome Browser (ce06): bet-2 (F57C7.1b (top) and F57C7.1a (bottom).
(D) Pol II pausing index at indicated genes in the mixed embryo (blue) and in the L3 larvae (red). The results of two independent experiments are shown. Error bars represent SD. * indicates a significance of p < 0.05, and ** indicates p < 0.01 in comparison to the embryo stage.
(E) Expression of the indicated genes in the mixed embryo (blue) and L3 larvae (orange) relative to act-3 mRNA expression as measured by qRT-PCR. The results of two independent experiments are shown. Error bars represent SD. * indicates a significance of p < 0.05, ** indicates p < 0.01, and *** indicates p < 0.005 in comparison to the embryo stage.
See also Figure S6.

