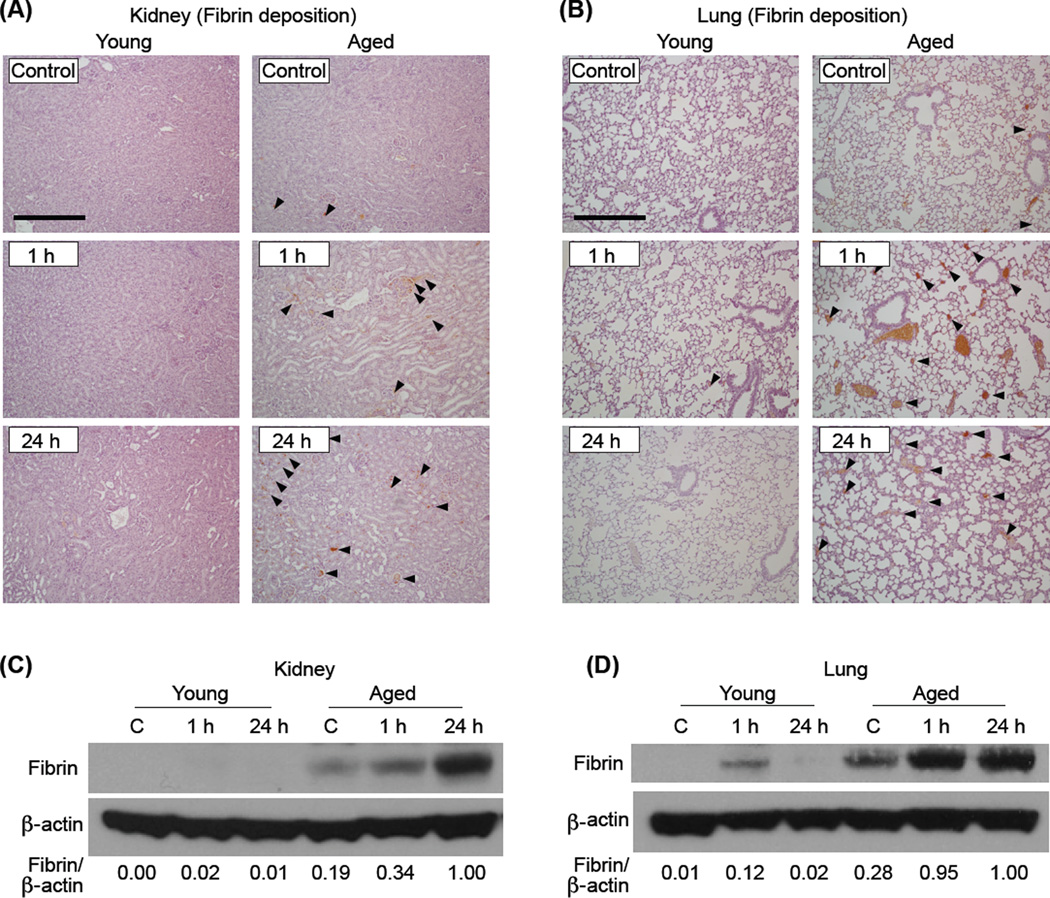
Figure 4. Fibrin formation in the kidney and lung was augmented in the aged after caerulein induced AP.
Immunohistochemical analysis of fibrin in the kidney (A) and lung (B) harvested from mice 1 or 24 h after the last caerulein injection. Arrowheads indicate fibrin positive areas (original magnification, 100x, scale bar indicates 200µm). Images are representative of 5 mice per group. Western blot analysis assessing fibrin formation in the kidney (C) and lung (D) of young and aged mice that were sacrificed 1 or 24 h after the final (9th) caerulein injection. n=4–8 in each group. Relative intensity of fibrin/β-actin in each sample, calculated after densitometric analysis, is shown under each lane.

