
Figure 1.
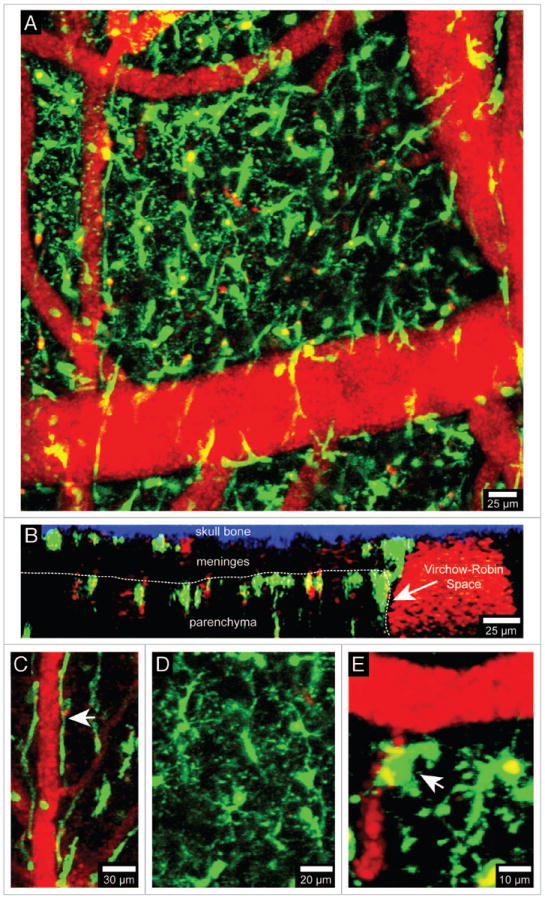
Visualization of brain myeloid cells in CX3CR1-GFP mice. TPLSM was used to capture 4D time-lapses through a thinned skull window of a naïve CX3CR1-GFP+/- mouse. The bone was thinned down manually to a thickness of ~30 μm and then imaged using a Leica SP5 two-photon microscope fitted with a 20x water dipping objective (1.0 NA). For imaging, the lens was dipped into artificial cerebral spinal fluid placed on top of the thinned skull window. Images were collected with a 1.0 μm step size to a depth of 100 μm beneath the skull surface. Z stacks were acquired every minute. Panel A shows the xy distribution of innate myeloid cells (green) in the meninges and neocortex of a naïve mouse brain. Blood vessels (red) were labeled by injecting 655-nm quantum dots intravenously before imaging. Panel B shows an xz projection from the same image stack in which the skull bone (blue), meninges, and brain parenchyma are visible. The white dotted line denotes the glial limitans. The Virchow-Robin space adjacent to a large blood vessel is also visible (white arrow). Note that the density of innate myeloid cells is greater in the parenchyma than in the meninges. CX3CR1-GFP+/- mice can be used to visualize meningeal macrophages (C, white arrow), microglia (D), and perivascular macrophages (E, white arrow). Meningeal macrophages (C) are worm-like cells that line blood vessels in the meninges. Perivascular macrophages (E) reside in Virchow-Robin spaces and adjacent to blood vessels found the brain parenchyma (white arrow). Microglia (D) are the most common CNS myeloid cell and are distributed uniformly throughout the brain parenchyma. Note that microglia are highly ramified cells, whereas meningeal and perivascular macrophages are not. See Video S1.