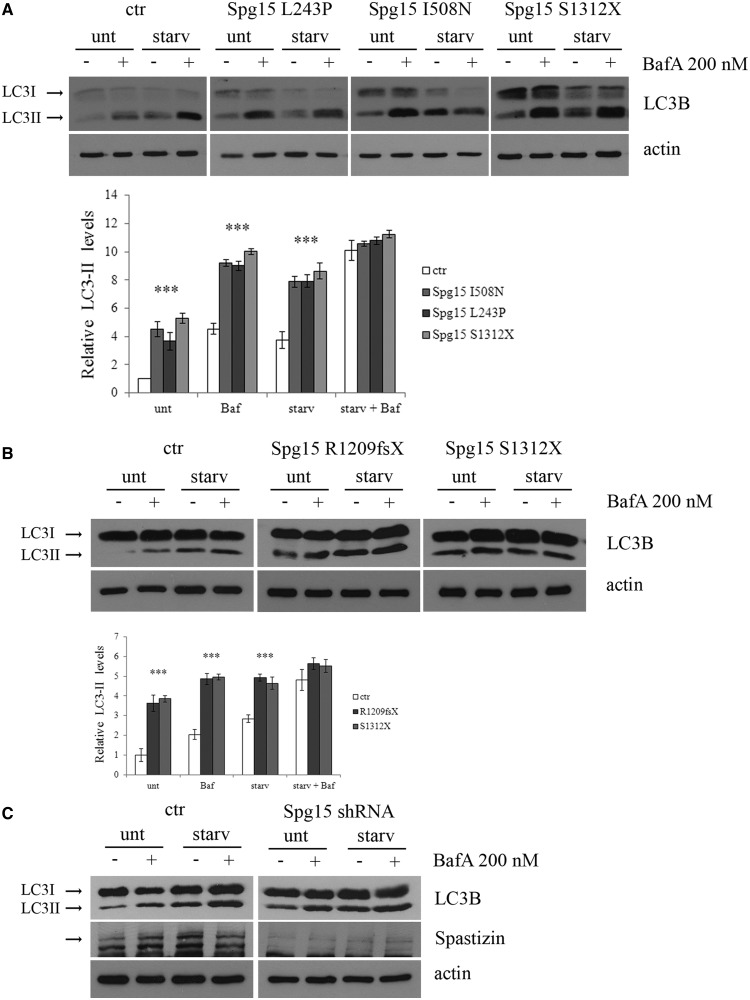
Figure 9.
Analysis of the effect of autophagy inhibition with bafilomycin A1 in control and spastizin (Spg15) mutated cells. (A) L243P, I508N and S1312X spastizin mutated and four different control (one is shown, the others are reported in Supplementary Fig. 7B) lymphoblast cells were incubated with 200 nM bafilomycin A1 in complete medium (unt) or in starvation medium (starv) for 1 h. Total protein extracts were run on 12% SDS-polyacrylamide gels and probed with anti LC3B and actin antibodies. Shown is a representative blot out of three reproducible ones. LC3-II levels were quantified and normalized on actin levels. The mean of the four controls is reported in the graph. The graphs show the mean ± SEM of three independent experiments (***P < 0.001). (B) Fibroblast cells from patients carrying R1209fsX and S1312X spastizin mutations and from a control were incubated with 200 nM bafilomycin A1 and processed as in A. The graphs show the mean ± SEM of three independent experiments (***P < 0.001). (C) HeLa cells were transfected with ZFYVE26 (Spg15) short hairpin RNA or with a control vector (ctr) and 72 h later were incubated with Bafilomycin A1 as described above. Total extracts were probed with anti-LC3B, -actin and -spastizin antibodies, the latter to show the residual spastizin levels in ZFYVE26 (Spg15) short hairpin RNA-transfected cells. Shown is a representative of three reproducible blots.

