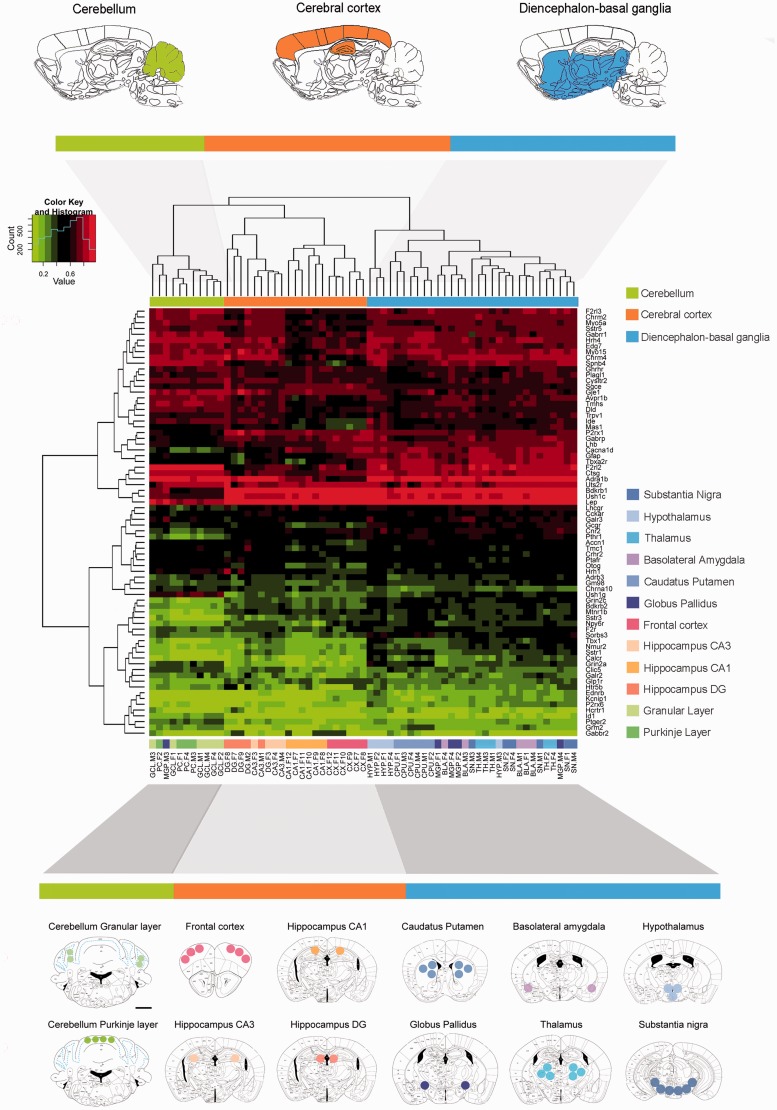
Figure 1.
Unsupervised heatmap clustering of a genome-wide promoter DNA methylation microarray across 12 brain regions in the C57BL/6 mouse. A schematic representation of studied regions was performed on plates adapted from the mouse brain in a stereotaxic coordinates atlas. The circles and areas mark sites from which brain tissue was dissected. The frontal cortex (distance from the bregma, +2.68), caudate-putamen (+0.98), basolateral amygdala (−0.90 to −0.95), hypothalamus (−0.82), globus pallidus (−1.20), thalamus (−1.34), hippocampus (−1.94, hippocampal field CA3, CA1 and dentate gyrus, DG), midbrain area (substantia nigra + ventral tegmental area, −3.08), and cerebellum (−5.80, granular cell layer, GCL; Purkinje cells, PC) were microdissected. Red and green colours indicate high and low levels of DNA methylation, respectively. Scale bars = 1 mm.

