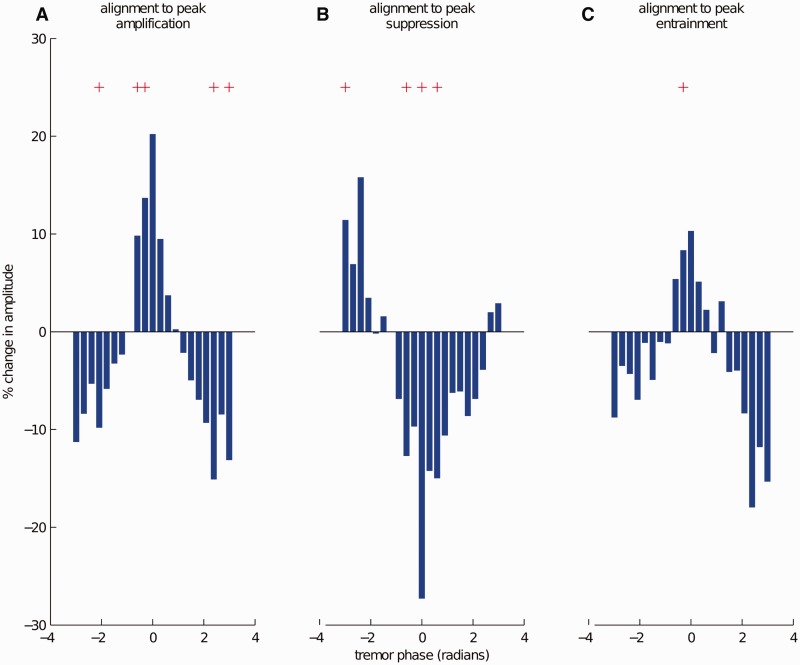
Figure 3.
Group data for amplitude changes due to stimulation at near postural tremor frequency (fT). Individual phase-amplitude profiles were (A) aligned to peak amplification (at 0 radians); (B) aligned to peak suppression (at 0 radians); (C) aligned to the phase where maximal entrainment is observed (at 0 radians) and averaged in order to obtain the phase-amplitude profiles at the group level. Red plus sign indicates amplitude changes, which are significantly different from tremor amplitude variability when the stimulation is turned off (Student’s t-test at each phase bin, FDR corrected for multiple comparisons). Note that suppressive and amplifying effects were out of phase suggesting that stimulation might be interacting with an underlying, alternating, oscillatory pattern of neuronal excitability at tremor frequency.

