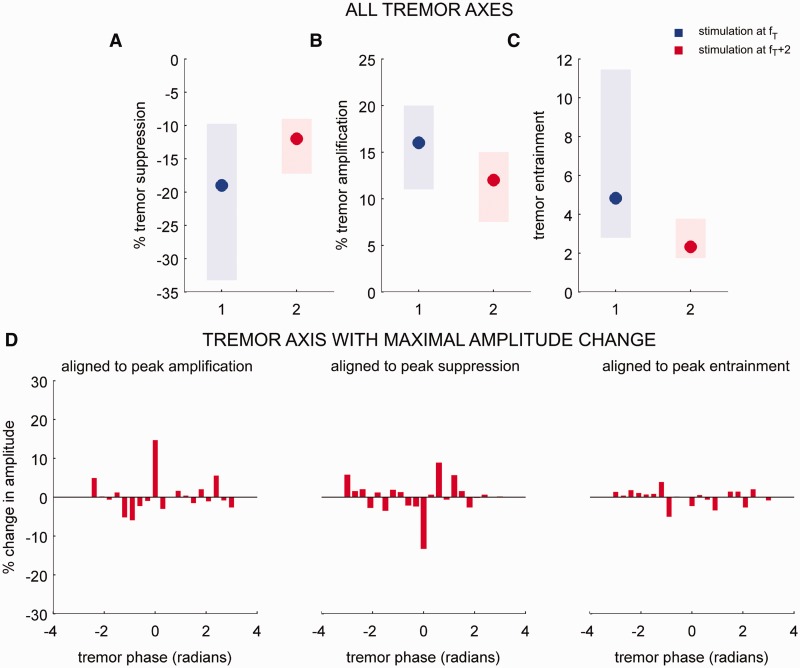
Figure 6.
Characterizing the effect of fT+2 Hz stimulation on essential tremor. Tremor entrainment and the ability of stimuli at given phases to either suppress or amplify tremor amplitude were dependent on stimulation frequency. Shaded regions in A−C depict 25–75% percentiles and dots depict median values. (A) Group data for tremor suppression observed when thalamic stimuli coincided with the tremor phase affording maximal tremor suppression across all three tremor axes of the tri-axial accelerometer during fT Hz stimulation (blue) and fT+2 Hz stimulation (red). Tremor suppression observed during fT+2 Hz stimulation is significantly different from that observed during fT Hz stimulation (Wilcoxon rank sum test P-value = 0.0388, FDR corrected) (B) Same as A for tremor amplification observed when thalamic stimuli coincided with the tremor phase affording maximal tremor amplification (Wilcoxon rank sum test P-value = 0.0161, FDR corrected). Moreover (C) tremor entrainment was less than those observed during fT Hz stimulation (Wilcoxon rank sum test P-value = 0.0157, FDR corrected). (D) Group average phase-amplitude profile, observed during fT+2 Hz stimulation, at the tremor axis with maximal amplitude change. The amplitude profiles, when aligned to the phase where maximal amplification, suppression or entrainment was observed, showed no significant difference with respect to tremor amplitude variability when DBS was off. Phase-amplitude interactions for DBS off cases were reconstructed with respect to an artificial stimulation train at fT+2 Hz.

