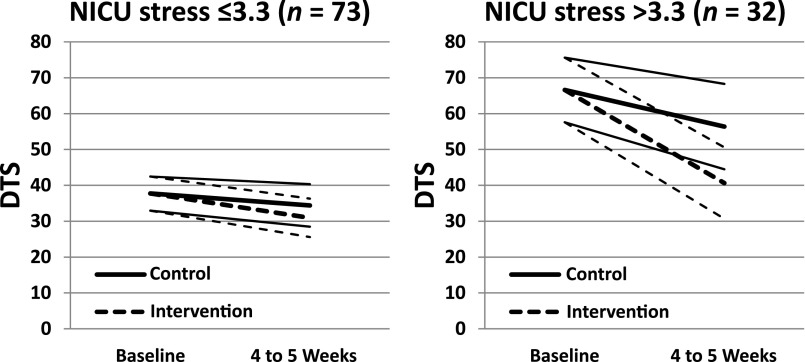
FIGURE 3.
Baseline NICU stress moderating the effect of intervention on DTS decline; DTS trajectories are based on mixed effects growth model estimates. The thick lines represent means, and the thin lines represent 95% confidence bands. The moderator analysis was conducted by using the continuous NICU stress measure. The score was split into 2 categories in the graphic to help readers visualize the moderating effect of NICU stress.

