
Figure 2.
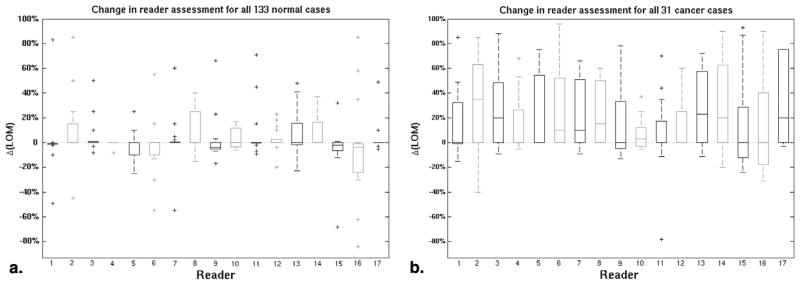
The change in reader-assigned likelihood of malignancy, Δ(LOM), between the x-ray mammography (XRM)-alone and XRM + three-dimensional automated breast ultrasound (ABUS) conditions for the (a) actually normal cases and (b) actually cancerous cases. In all box plots in this report, the bottom and top of each box denote the 25th and 75th percentiles, respectively, while the horizontal line within denotes the median value. Whiskers extend to mark the range in values not considered outliers, while individual outliers are marked with a “+.”