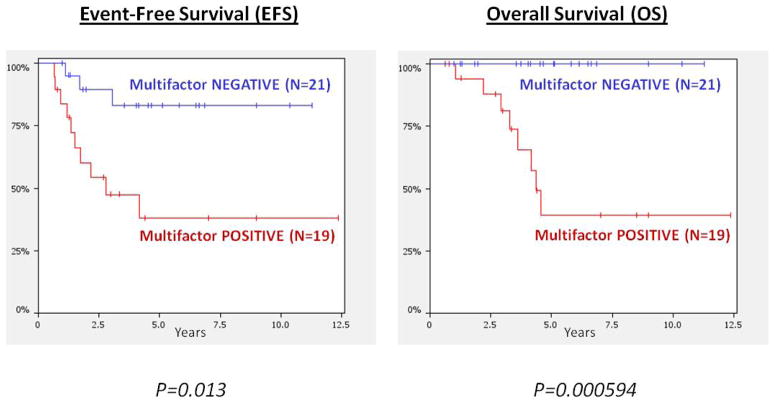
Figure 3. Kaplan-Meier curves for Multifactor Copy Number (MCN) Index.
These survival plots display the multifactor copy number (MCN) index comprised of any sample that contains a copy number alteration (CNA) in any of the following regions: 20q13.2 gain, 20q13.13 [CEBPB] gain, MYC gain, 16q24.1 deletion, 16q23.3-24.1 deletion, Trisomy 5, Trisomy 8, Trisomy 20. The lower, red line represents the 19 individuals with a CNA in at least one region (“Multifactor-POSITIVE”) while the blue line represents the 21 individuals with no CNA in any of the regions (“Multifactor-NEGATIVE”). The MCN-index correlated significantly with both EFS (P=.013) and OS (P=.00059).

