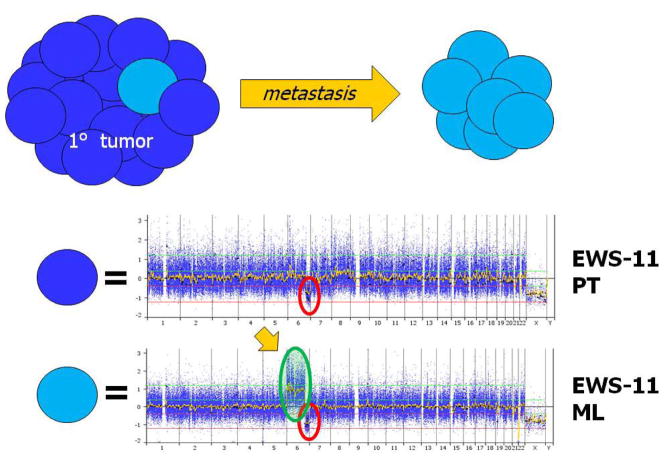
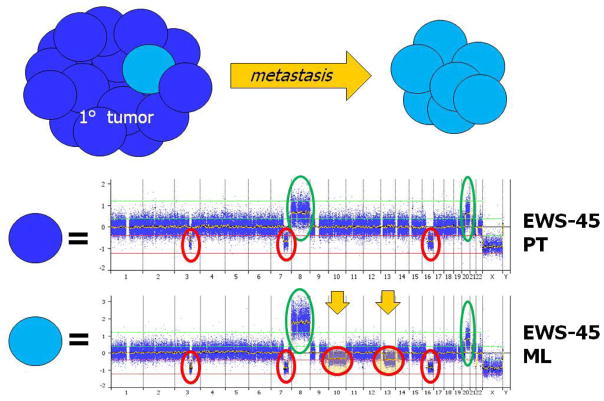
Figure 4.
Figures 4a and b. Paired Metastatic Lesions.
Two sets of paired diagnostic and metastatic lesions are displayed. X-axis represents chromosomes labeled and divided by bars, and Y-axis represents linear copy number values re-centered on zero (0=2 copies). Figure 4a) Note the progression of CNAs in the metastatic lesion with the acquisition of trisomy 6p in addition to the 6q deletion already present at diagnosis. Figure 4b) Note the metastatic acquisition of chromosome 10 and 13 deletions in an already genomically unstable diagnostic sample. Also note that the deletions are subclonal in nature with copy number values of 1.5 (ie., only half the metastatic tumor contains subclones with the newly acquired deletions).


