
Fig. 1. The distribution in expression levels of HLA-C allotypes present in African Americans.
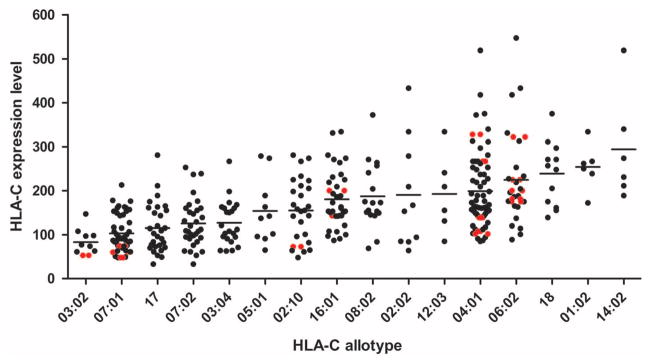
Peripheral blood CD3+ cells from 200 healthy donors were analyzed by flow cytometry for HLA-C expression level using the monoclonal antibody DT9. MFI of HLA-C staining is plotted twice for each donor (i.e., once for each HLA-C allele present), with HLA-C homozygous individuals marked in red. Expression level correlates significantly with HLA-C allotypes in analysis of variance (P = 5 × 10⁻²¹).