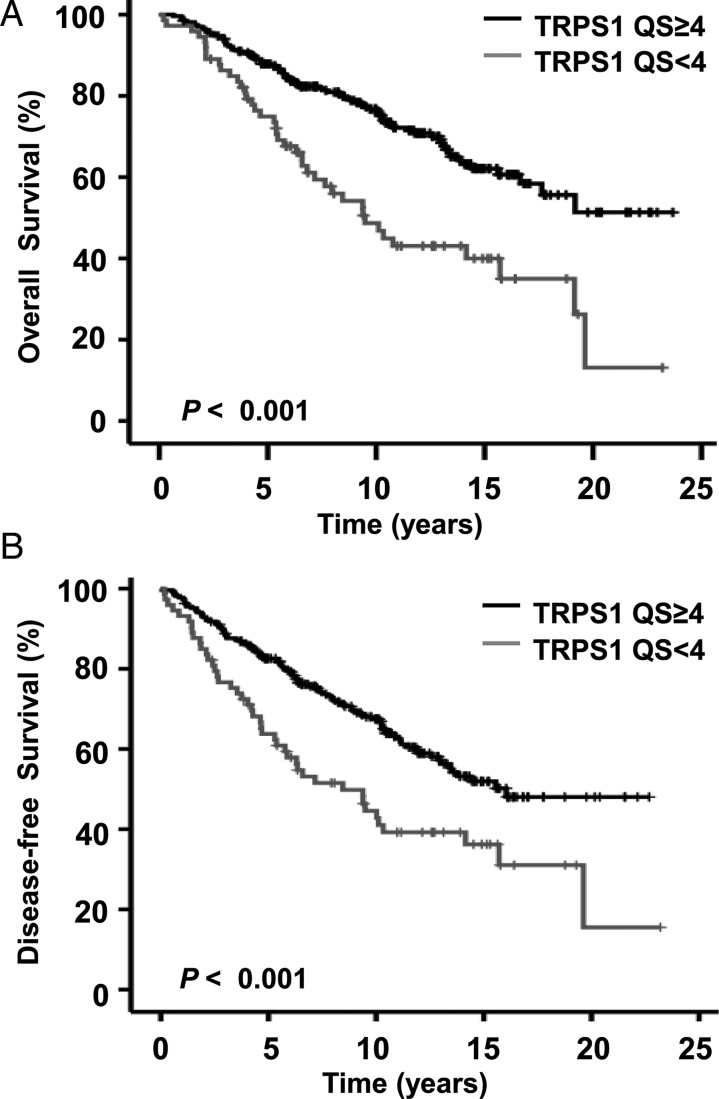
Figure 1.
Kaplan–Meier analysis of OS (A) and DFS (B) durations in 341 patients with stage I–III BC. Survival probability (in years from primary surgery) was evaluated for TRPS-1 QS at ≥4 versus < 4. The P values were calculated using log-rank analysis. Patients with a TRPS-1 QS of ≥4 had significantly longer OS (A) and DFS (B) durations versus <4.

