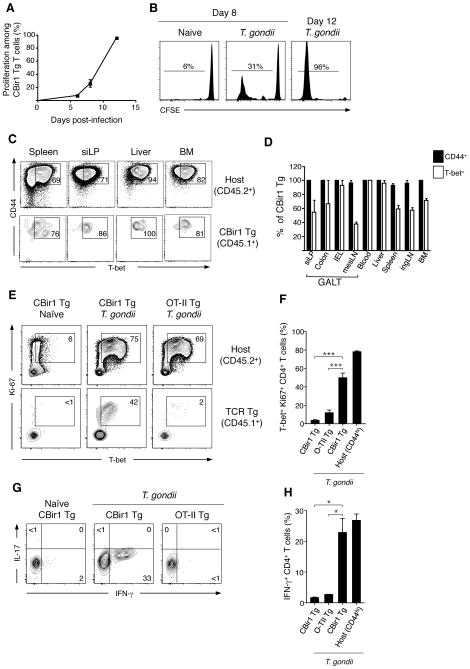
Figure 2. Gastrointestinal infection leads to the activation and Th1 differentiation of microbiota-specific T cells.
(A and B) 105 CBir1 Tg (CD45.1) T cells were labeled with CFSE and transferred into congenic (CD45.2) hosts that were subsequently infected orally with 15 cysts of T. gondii. At 6, 8 or 12 days p.i. splenocytes were isolated and the dilution of CFSE on CBir1 Tg T cells (Live TCRβ+ CD4+ CD45.1+) assessed by flow cytometry; N=1, n=3–4 mice per time point. (C) 7.5×10⁴ CBir1 Tg (CD45.1) T cells were transferred into congenic (CD45.2) hosts that were subsequently infected orally with 15 cysts of T. gondii. Eighteen days p.i., single cell suspensions were prepared from the spleen, ingLN, mesLN, bone marrow, liver, peripheral blood, siLP, IEL and colon and stained intracellularly for flow cytometry. Contour plots show expression of CD44 and T-bet amongst CBir1 Tg (CD45.1) CD4 T cells (bottom row) and host CD4+ T cells (D) Bar graph showing the frequency of CBir1 Tg T cells from (C) expressing CD44 (black bars) and Tbet (white bars); N=1–8, n=3 mice. (E) 7.5×10⁴ CBir1 Tg (CD45.1) or OTII T cells were transferred into congenic (CD45.2) hosts that were subsequently infected orally with 15 cysts of T. gondii or left naïve. Eight days p.i. splenocytes were isolated and stained intracellularly for flow cytometry. Flow cytometric analysis of T-bet and Ki67 in CBir1 Tg or OTII TCR Tg (bottom row) and host CD44hi CD4 T cells (top row). Shown is a representative example of eight separate experiments. (F) Quantification of (E). (G) Splenocytes from (E) were stimulated with PMA/ionomycin, stained intracellularly for IFN-γ and IL-17 and analyzed by flow cytometry. (H) Quantification of (G). Data is representative of three separate experiments. All flow cytometry plots in this figure are gated on Live TCRβ+ CD4+ Foxp3−. Graphs show mean +/- SEM *p<0.05, ***p<0.001.

