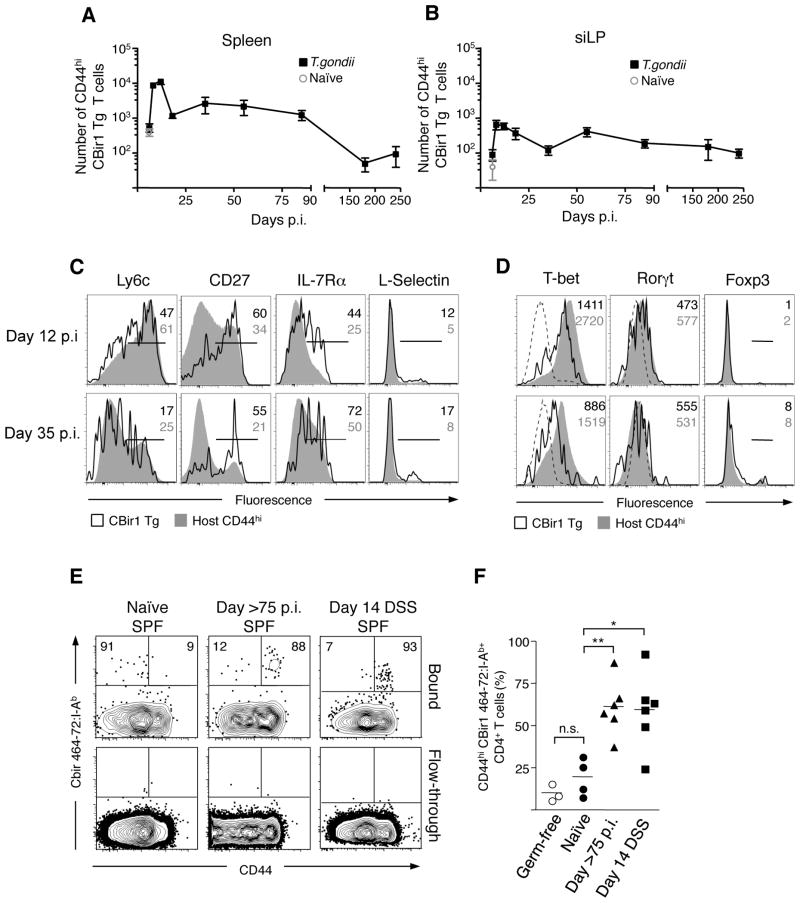
Figure 3. Gastrointestinal infection induces microbiota-specific memory CD4 T cells.
(A and B) 7.5×10⁴ CBir1 Tg (CD45.1) T cells were transferred into congenic (CD45.2) hosts that were subsequently infected orally with 15 cysts of T. gondii. At the days indicated, splenocytes (A) and siLP cells (B) were isolated and the number of CD44hi CBir1 Tg T cells (black squares) in each tissue was assessed by flow cytometry. Open grey circle shows the number of CD44hi CBir1 Tg T cells in naïve mice eight days after transfer of CBir1 Tg T cells; N=1–8, n=3–15 mice per timepoint (C) Flow cytometric analysis of surface marker phenotype of transferred CBir1 Tg T cells (CD45.1) (black line) and host CD44hi T cells (CD45.2) (grey filled) at day 12 and day 35 p.i. isolated from the spleen (D) Expression of transcription factors in CBir1 Tg T cells (CD45.1) (black line) and host CD44hi T cells (CD45.2) (grey filled) at day 12 and day 35 p.i. isolated from the spleen. Histograms in (C) and (D) are gated on Live TCRβ+ CD4+; Data shown is representative of three separate experiments (E) Flow cytometric analysis of CBir464- 72:I-Ab tetramer binding populations from the total secondary lymphoid tissue in naïve, >day 75 T. gondii infected and DSS-treated mice. The top row depicts the population bound during tetramer-specific separation; the bottom row shows the non-binding column flow-through to show specificity. Plots are gated on DAPI− NK1.1− F4/80− CD11c− CD11b− B220− CD3+ CD4+. (F) Bar graph shows the percent CD44hi of CBir464–72:I-Ab tetramer binding cells in germ-free (open circles), naïve (circles), infected (triangles) and DSS-treated (squares) mice. Data from (E) are representative of three experiments. Graphs show mean +/− SEM *p<0.05, **p<0.01.

