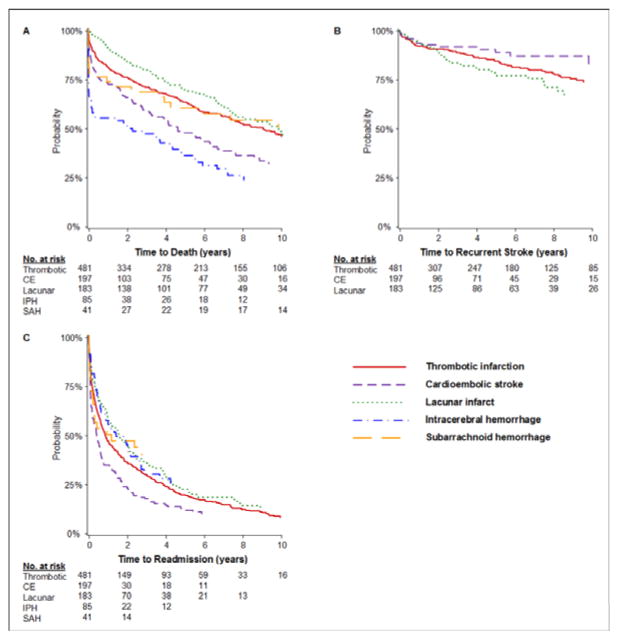
Figure 1.
Kaplan-Meier analysis of mortality, recurrence, and readmission by subtype. Survival curves are for all-cause mortality (A), first recurrent stroke event (B), and first hospital readmission for any cause (C) in the 10 years after index stroke event. Numbers of patients at risk at 2-year intervals are shown below the curves. Log-rank p-values for differences in survival by stroke subtype were 0.05 for mortality, 0.05 for recurrent stroke, and <0.0001 for hospital readmission. Recurrent stroke outcomes are not shown for hemorrhagic stroke subtypes due to small numbers of events.

