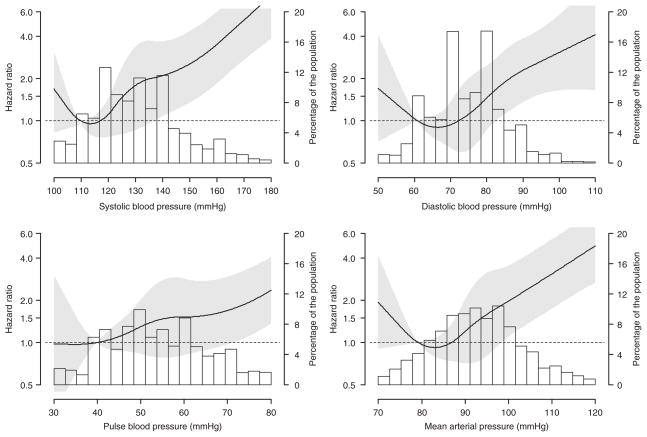
Figure 1.
Multivariable adjusted hazard ratios for end-stage renal disease associated with systolic blood pressure, diastolic blood pressure, pulse pressure, and mean arterial pressure. Black line represents the hazard ratio, gray area is the 95% confidence interval. Bars represent the percentage of the population. Hazard ratios are adjusted for age, race, sex, geographic region of residence, current smoking, physical activity, income, waist circumference, highsensitivity C-reactive protein, history of cardiovascular disease, diabetes, high-density lipoprotein-cholesterol, antihypertensive medication use, and estimated glomerular filtration rate.

