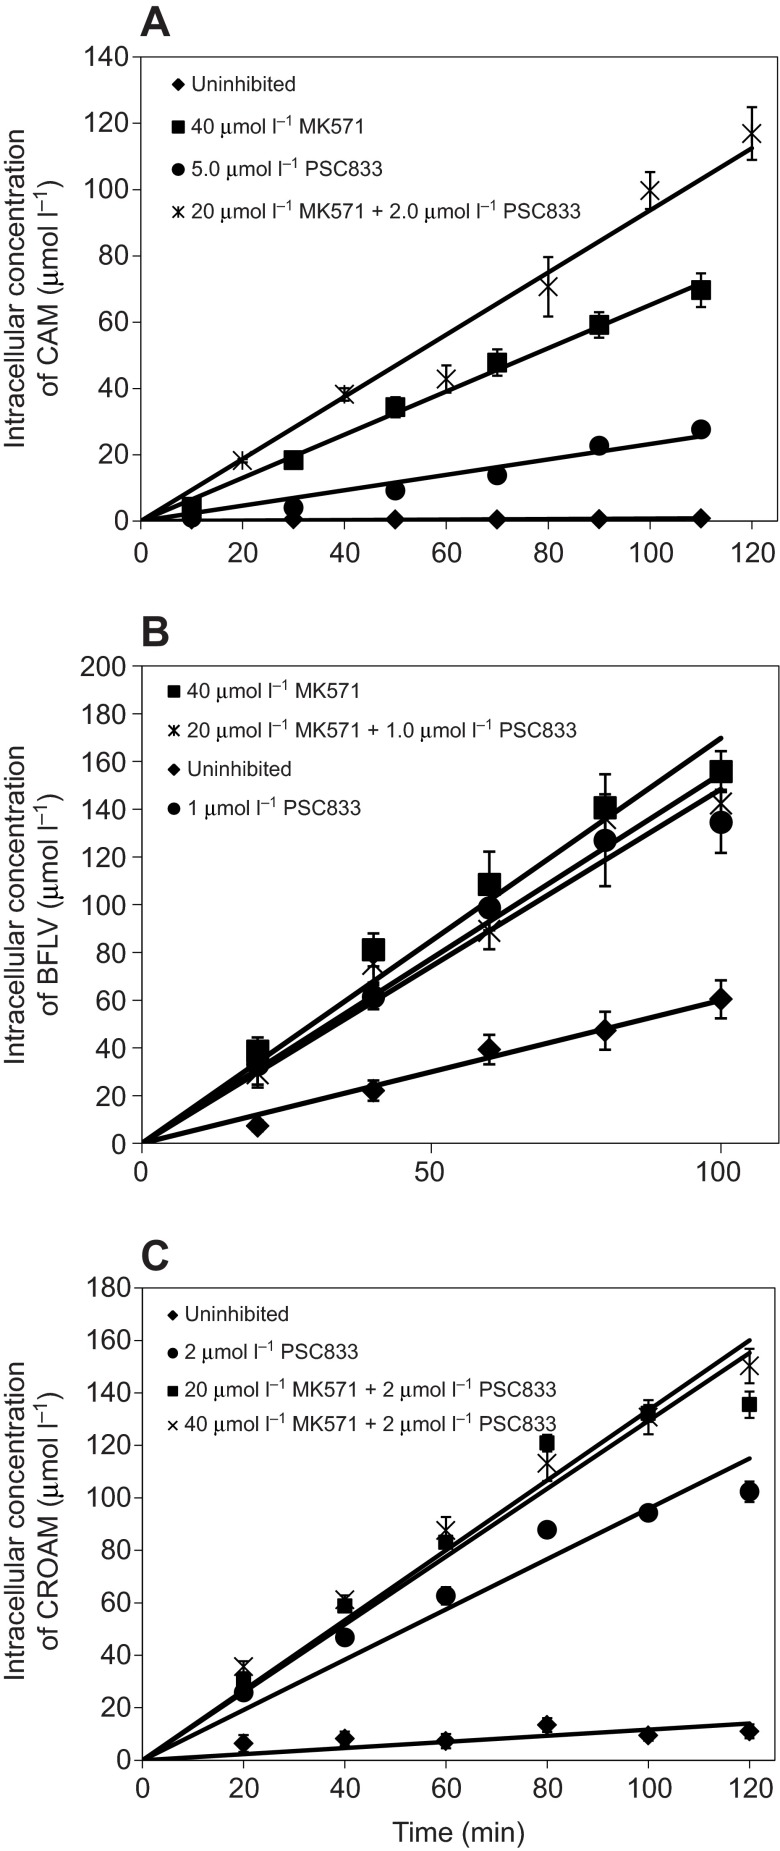
Fig. 2.
Intracellular concentrations of the transporter substrates CAM (A), BFLV (B) and CROAM (C) in the presence of the indicated concentrations of transporter inhibitors. In all cases, embryos were exposed to 0.25 μmol l−1 extracellular substrate concentration. All regressions are linear with the x-intercept set to the origin, as there is no fluorescence expected at 0 min, after normalization for any background. Regression lines for all inhibitor exposures have R2 values greater than 0.9.

