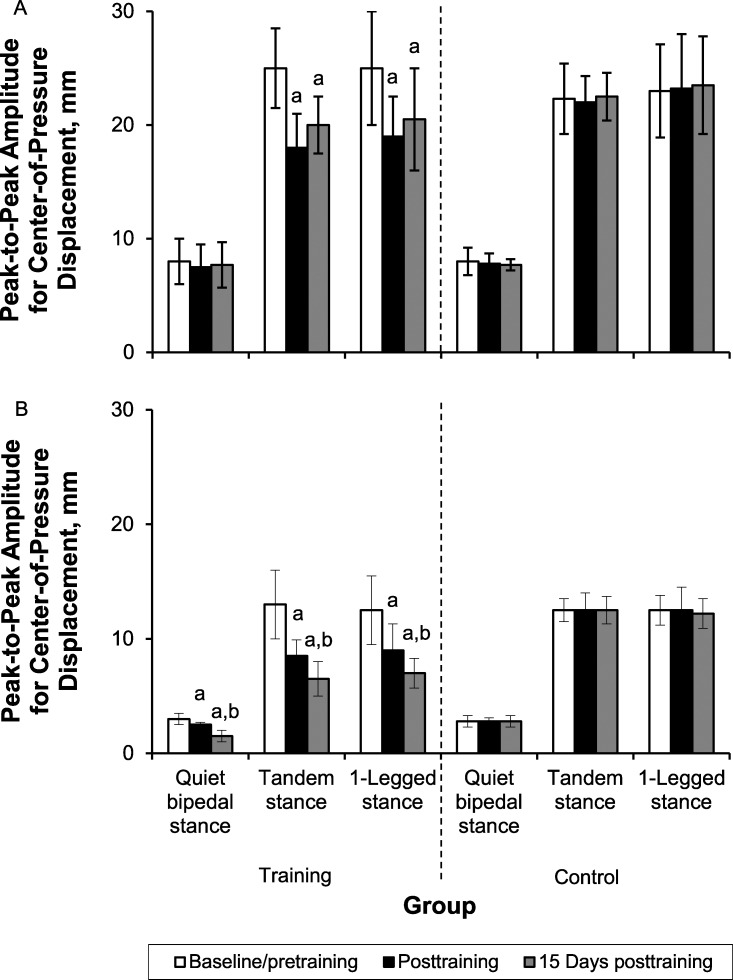
Figure 2. .
The peak-to-peak amplitude of center-of-pressure displacement in the A, anteroposterior axis, and B, mediolateral axis; and the SD of center-of-pressure displacement in the C, anteroposterior axis, and D, mediolateral axis, across the 3 postural tasks of quiet bipedal stance, tandem stance, and 1-legged stance at baseline/pretraining, immediately posttraining, and at 15 days posttraining for the training and control groups. a Indicates lower than baseline/pretraining (P < .05). b Indicates lower than posttraining (P < .05). Figure continued on next page.

