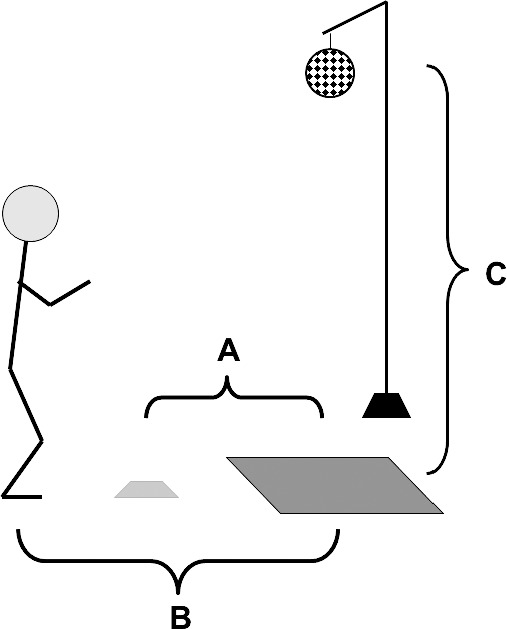
Figure 2. .

Diagram of the jumping task that was used during testing. A, From center of force plate to starting position is 25% of participant's height. B, From center of force plate to starting position is 50% of participant's height. C, Center of soccer ball is 50% of maximum vertical jump height.
