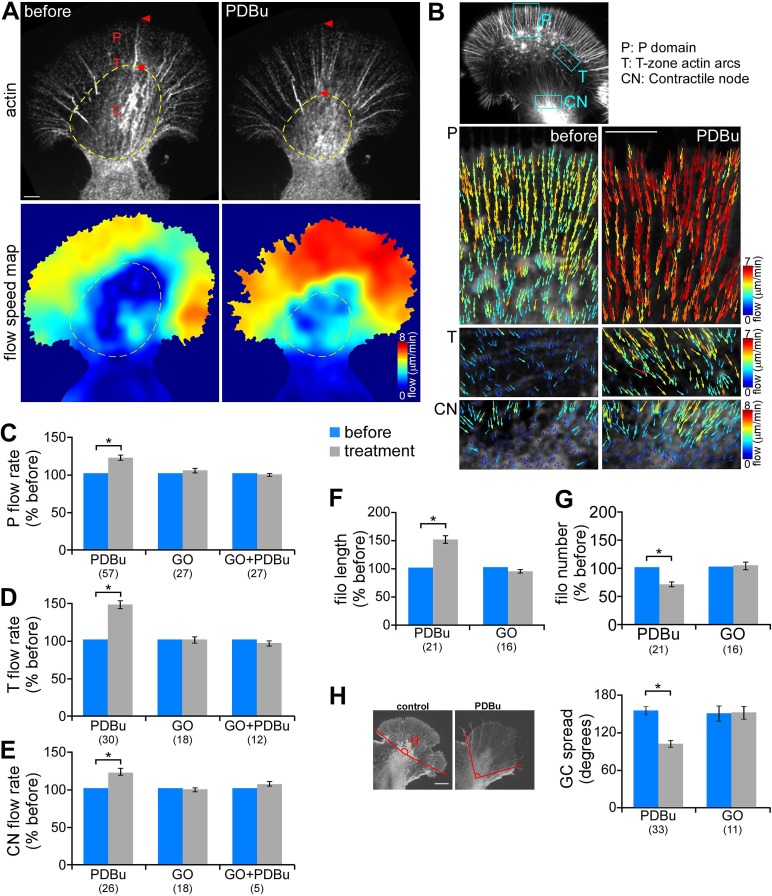
FIGURE 2:
PKC activation increased retrograde actin filament flow rate and contraction of central actin networks. (A) Representative actin FSM images (top) and corresponding spatially averaged flow speed maps (bottom) from a growth cone injected with Alexa 594–phalloidin before and after PDBu treatment (100 nM, 10 min). Yellow dotted circle marks the C-domain boundary. (B) Representative flow vector fields in the P domain (top), T zone enriched with actin arcs (middle), and contractile node (bottom) before and after PDBu treatment. Each field was obtained from an area similar to the boxed region in the inset, respectively. On both flow speed and vector maps, colors encode flow magnitude (see color bar). Vectors also indicate the flow direction. (C–E) Summary of relative changes in P-domain (C), T-zone (D), and contractile node (E) actin network translocation rates in response to PDBu (100 nM, 10–30 min), Go6976 (10 μM, 10–30 min), or pretreatment with Go6976 (10 min) followed by cotreatment with Go6976 and PDBu (10–30 min). Translocation rates were calculated by averaging the vector magnitude within regions similar to those shown in B or by kymograph analysis. (F, G) Average filopodium length (F) and number (G) measured in growth cones before and after treatment with PDBu or Go6976. Data are normalized to the values before drug addition for each growth cone. (H) Growth cone spread before and after treatment with PDBu or Go6976 measured as the angle formed by outermost filopodial actin bundles (θ in schematic). Numbers in parentheses, growth cones measured. *p < 0.01, two-tailed paired t test. Scale bars, 5 μm.

