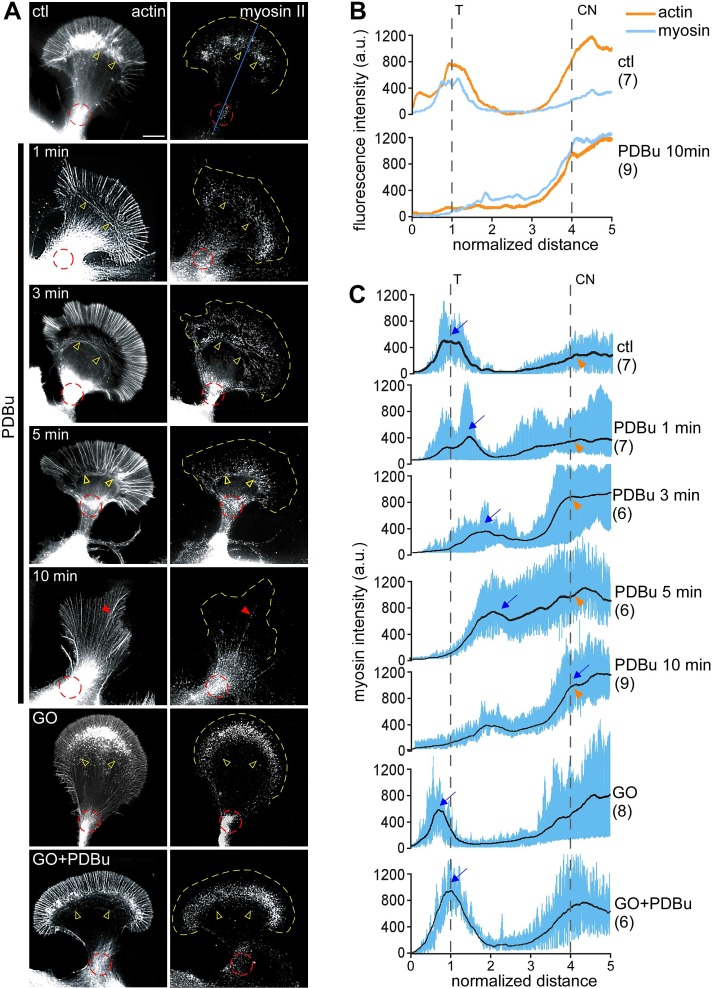
FIGURE 3:
PKC activation promoted a ring-like contractile response mediated by redistribution of myosin II to actin contractile node. (A) Fluorescence labeling of growth cones with myosin II heavy chain tail antibody (right) and tetramethylrhodamine isothiocyanate (TRITC)–phalloidin (left) after live-cell extraction. Growth cones were treated with DMSO, PDBu (100 μM, 1–10 min), or Go6976 (10 μM, 10 min) or pretreated with Go6976 (10 min), followed by Go6976 and PDBu (10 min). Yellow open arrowhead, actin arc; red dotted circle, contractile node; red arrowhead, filopodia; yellow dotted line traces the leading edge. (B) Line scan analysis of actin (orange) and myosin II (blue) fluorescence intensities under control conditions or after 10-min treatment with PDBu. Line scans (50 pixels in width, five times the P domain in length) were sampled along the growth axis, as represented by the blue line on the top in A. Traces in this graph are the average values of multiple growth cones. (C) Line scan analysis of myosin II localization in growth cones under the conditions in A. Samples were measured in a manner similar to B. Blue lines represent data from individual growth cones. Black lines represent the population average. CN, contractile node; T, transition zone; blue arrow, peak of myosin II fluorescence in T zone; orange arrowhead, myosin II fluorescence at contractile node. Number in parentheses, growth cones measured. Scale bar, 10 μm.

