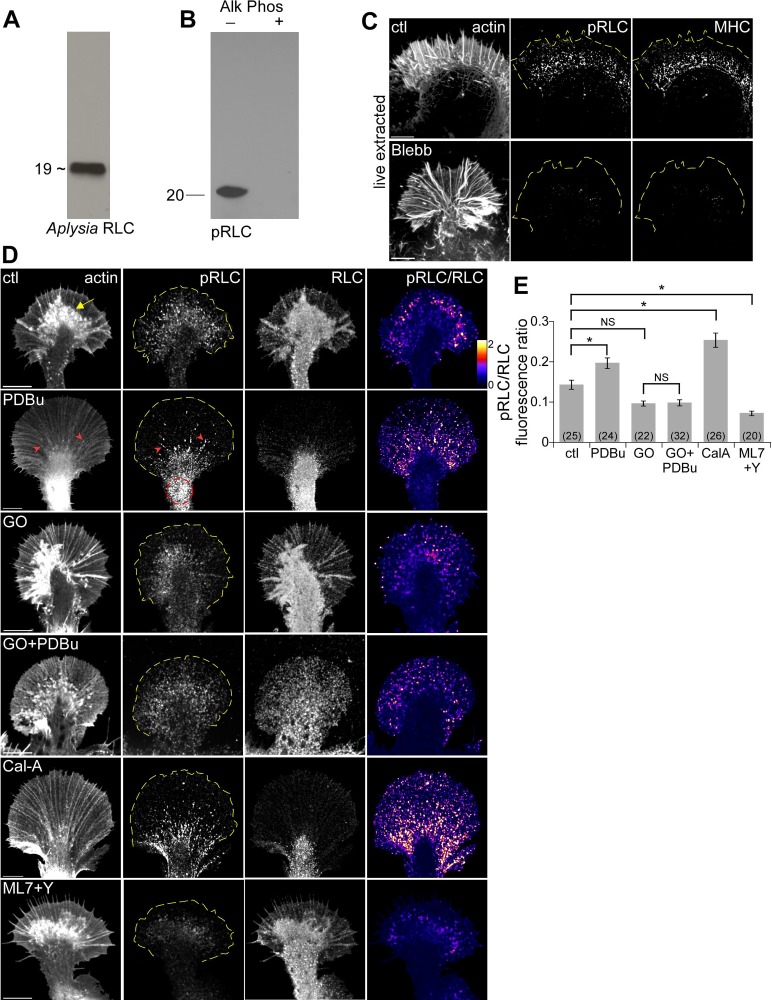
FIGURE 5:
PKC activation increased myosin II regulatory light chain phosphorylation. (A) Western blots of Aplysia CNS proteins probed with rabbit anti–Aplysia RLC sera recognizing ∼19-kDa band. (B) Western blot of control and alkaline phosphatase–treated Aplysia CNS homogenate with a mouse monoclonal antibody against conserved pSer19 on human myosin II regulatory light chain (pRLC). (C) Growth cones were live cell extracted and labeled with TRITC–phalloidin (left), antibody against conserved pSer19 on human myosin II regulatory light chain (pRLC; middle), and antibody against Aplysia myosin II heavy chain (MHC; right) after treatment with DMSO or blebbistatin (60 μM, 10 min). (D) Immunolabeling of growth cones with pRLC antibody and total Aplysia RLC antibody after normal fixation. F-actin was visualized with phalloidin. Right, ratio of pRLC and Aplysia RLC after background subtraction, encoded in a linear pseudocolor lookup table (see color bar). Growth cones were treated with DMSO, PDBu (100 nM, 10 min), Go6976 (10 μM, 10 min), Go6976 and PDBu (10 min) after Go6976 pretreatment, calyculin A (50 nM, 20 min), or combination of Y27632 and ML7 (10 μM each, 20 min). Yellow arrow, intrapodia; red arrowhead, filopodium; red dotted circle, contractile node; yellow dotted line traces the leading edge. (E) Quantification of average pRLC/RLC fluorescence ratio in entire growth cones for each of the conditions in D. Numbers in parentheses, growth cones measured. p < 0.0001 with single-factor ANOVA. Asterisk indicates significant difference using Tukey's HSD post hoc analysis. NS, not significant. Scale bars, 10 μm.

