FIGURE 7:
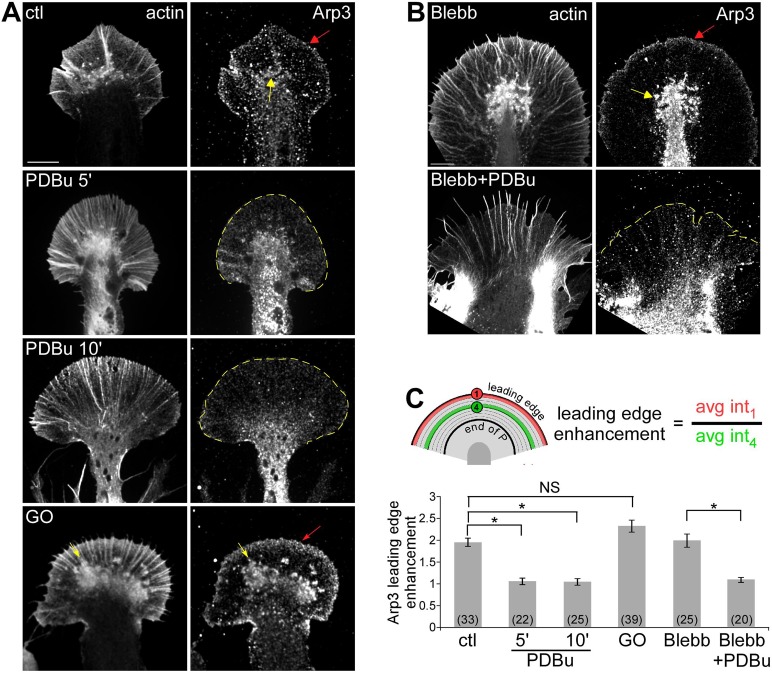
PKC activation disrupted Arp2/3 complex localization at the leading edge independent of myosin II activity. (A, B) Fluorescence labeling of growth cones with phalloidin and Arp3 antibody after normal fixation. (A) Growth cones were treated with DMSO, PDBu (100 nM, 5 and 10 min), or Go6976 (10 μM, 10 min). (B) Growth cones treated with blebbistatin (60 μM, 10 min) or pretreatment with blebbistatin followed by cotreatment with blebbistatin and 100 nM PDBu for 10 min. Red arrow, band of concentrated Arp2/3 complex localization at the leading edge; yellow arrow, intrapodia. Yellow dotted line traces the leading edge. Scale bar, 10 μm. (C) Quantification of Arp2/3 complex enrichment at the leading edge for each condition in A and B. The enrichment was calculated as the ratio of Arp3 fluorescence along the leading edge to a parallel region in the adjacent P domain (schematic). p < 0.0001 with single-factor ANOVA, Asterisk indicates significant difference using Tukey's HSD post hoc analysis. NS, not significant.

