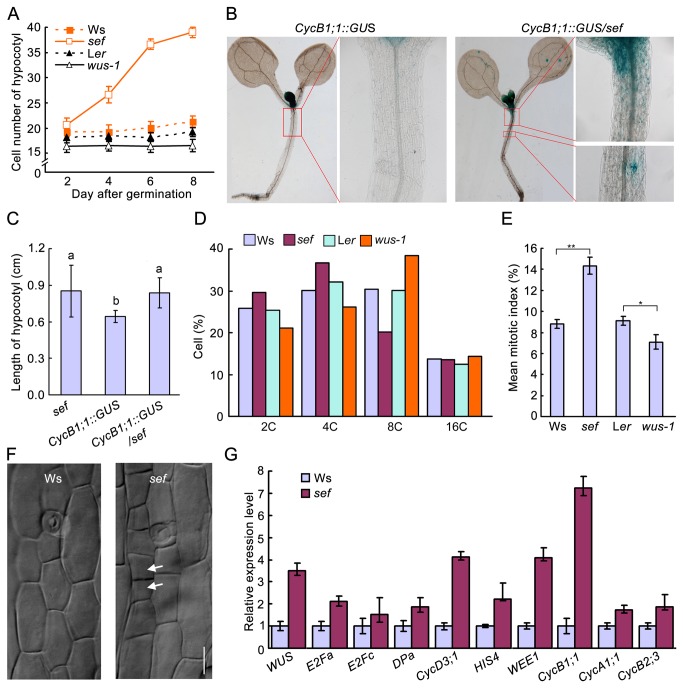
Figure 2. Aberrant cell division in hypocotyl of sef.
(A) Cell number of hypocotyl at given days after germination. Data are means ± SD (n > 15). (B) CycB1;1::GUS expression patterns in 8-day-old seedling of CycB1;1::GUS and CycB1;1::GUS/sef. (C) Hypocotyl length of 8-day-old sef, CycB1;1::GUS and CycB1;1::GUS/sef seedlings. Data shown are average values ± SD (n > 15). Different letters represent significant differences according to Student’s t test, *P < 0.05. (D) Cell cycle progression in hypocotyls of Ws, sef, Ler and wus-1 detected by flow cytometry. (E) Mean mitotic index in hypocotyls of Ws, sef, Ler and wus-1. Student’s t test, **P < 0.01, *P < 0.05. (F) Cell division in the hypocotyls of 4-day-old sef seedlings. Bar = 25 µm. (G) Expression levels of cell cycle-related genes in wild type and sef. Data are means ± SD (n = 3).

