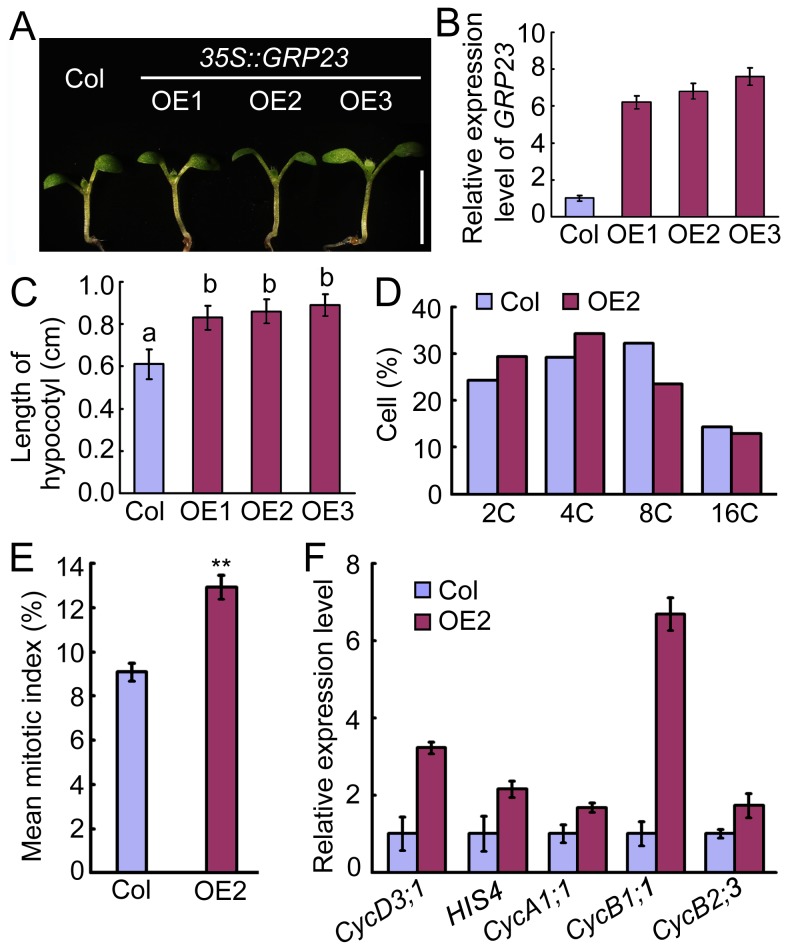
Figure 6. Phenotype of 35S::GRP23 transgenic plants.
(A) Hypocotyl phenotype of Col and 35S::GRP23 transgenic lines (OE1, OE2, and OE3) after germination for 8 days. Bars = 1 cm.(B) GRP23 expression in Col and 35S::GRP23 seedlings detected by qRT-PCR. Data are means ± SD (n = 3). (C) Hypocotyl length of Col and 35S::GRP23 seedlings after germination for 8 days. Data are means ± SD (n > 15). Different letters a and b represent significantly differences among the lines (*P < 0.05) by Student’s t test. (D) Cell cycle progression in hypocotyls of Col and 35S::GRP23 line 2 (OE2) analyzed by flow cytometry. (E) Mean mitotic index in hypocotyl of Col and 35S::GRP23 line 2. Student’s t test, **P < 0.01. (F) Expression levels of cell cycle-related genes in Col and 35S::GRP23 line 2. Data are means ± SD (n = 3).

