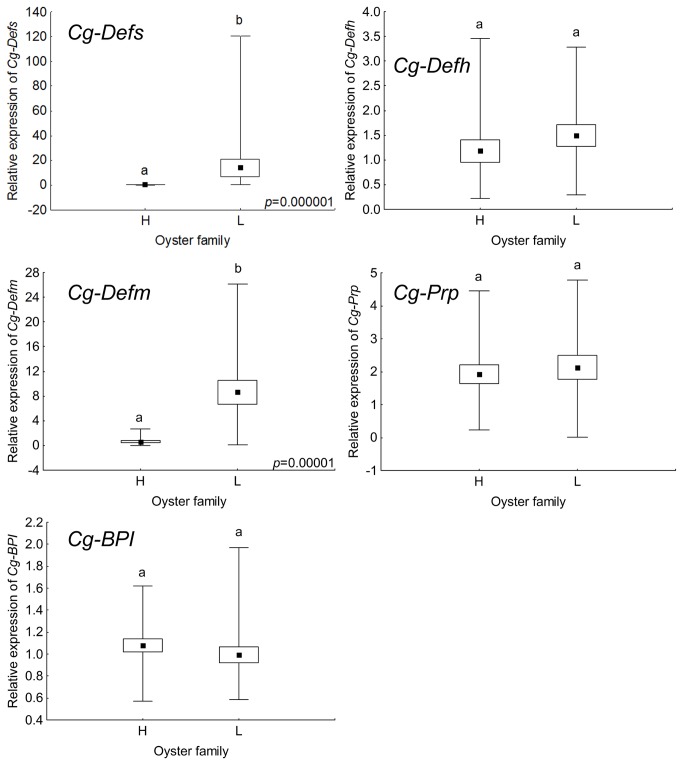
Figure 2. Gene expression of five antimicrobials in individual oysters from H and L lines.
Relative expression of antimicrobial peptides (Cg-Defs, Cg-Defh, Cg-Defm, and Cg-Prp) and protein (Cg-BPI), were obtained from H and L selected oyster lines (19 oysters per line). Relative expression are expressed as box plot, where central point represents the mean, box represents ± standard error, and plot represents minimum and maximum value. Relative expression levels were obtained according to the 2−ΔΔCq method [21]. Significant differences of relative expressions between oyster lines are indicated by different lowercase letters (different letters indicate significant difference, a or b) and were determined by the Mann-Whitney U test (p<0.05).

