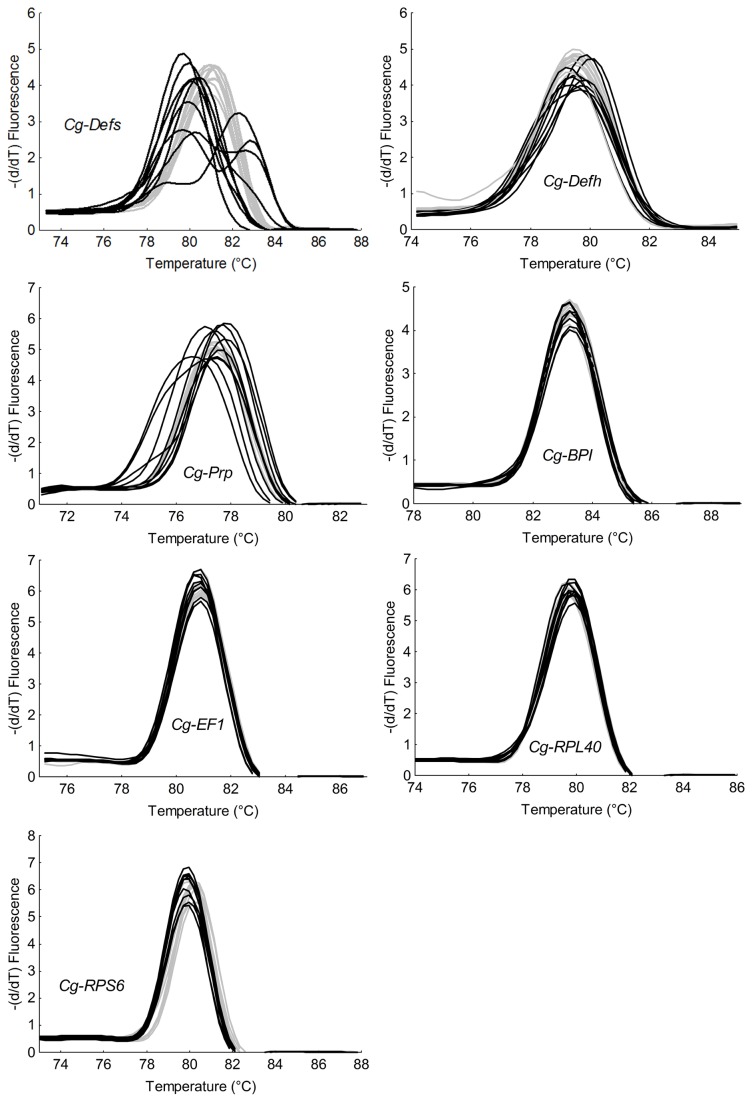
Figure 3. Melting temperature from transcript amplicons of four antimicrobial peptides and protein and three reference genes in individual oysters from H and L lines.
Graphs represent melting curves of qPCR amplicons of three antimicrobial peptides (Cg-Defs, Cg-Defh, and Cg-Prp), one antimicrobial protein (Cg-BPI), and three constitutively expressed genes (Cg-EF1, Cg-RPL40 and Cg-RPS6) from two selected oyster lines (ten oysters per line). H oyster line is represented in grey and L oyster line in black. The three antimicrobial peptides (Cg-Defs, Cg-Defh, and Cg-Prp) display a high variation on their melting temperatures is significantly associated with the L line (Fisher test, p<0.05) while other genes present same variations in each oyster lines (Fisher test, p>0.05).

