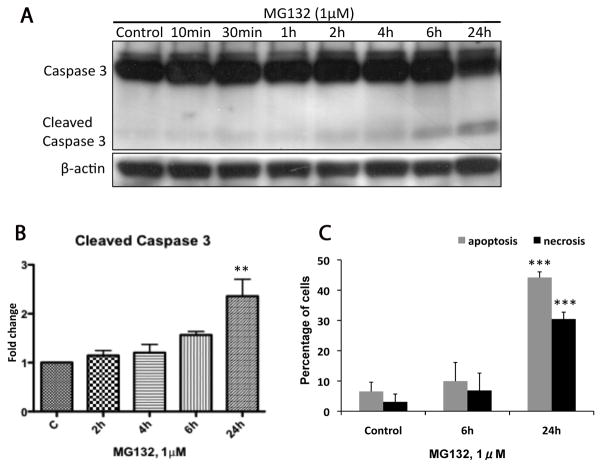
Figure 1. Time course of MG132 induced cytotoxicity.
The induction of apoptosis and necrosis was measured in N27 cells at 6 and 24h following treatment with MG132 (1μM). (A) The representative immunoblot shows caspase 3 cleavage increased to a significant level at 24h. (B) Fold changes of cleaved caspase 3 are normalized by control and estimated by densitometry. (C) Apoptosis was also measured in N27 cells using annexin V/PI cell staining in combination with flow cytometry. Significant apoptosis and necrosis were observed after 24h treatment. These data are presented as mean ± SD, (n=3–6); **p<0.01 and ***p<0.001 are considered significant by ANOVA using Dunnet’s multiple comparison test.

