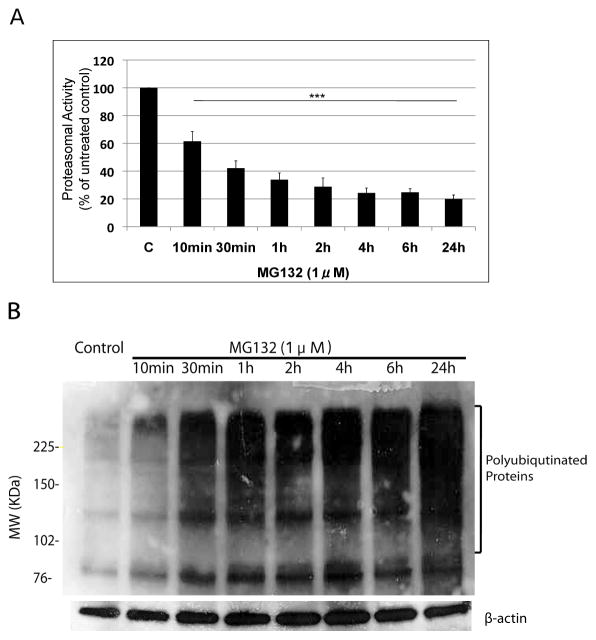
Figure 2. Time course of proteasome inhibition following treatment with MG132.
Proteasesome activity (A) and the accumulation of HMW polyubiquitinated proteins (B) were measured in N27 cells after treatment with MG132 (1μM). The proteasome activity was quantified by measuring fluorescence of Suc-Leu-Leu-Val-Tyr-AMC (chymotrypsin-like activity) cleavage at 380/460nm. The data is presented as mean ± SD, (n=3). ***p<0.001 is considered significant by one way analysis of variance (ANOVA) using Dunnet’s multiple comparison test. (B) The representative immunoblot blot shows time-dependent accumulation of higher molecular weight polyubiquitinated proteins and β-actin was included as a loading control.

