
Figure 2. Comparison of mammary gene neighborhood size with those of other tissues.
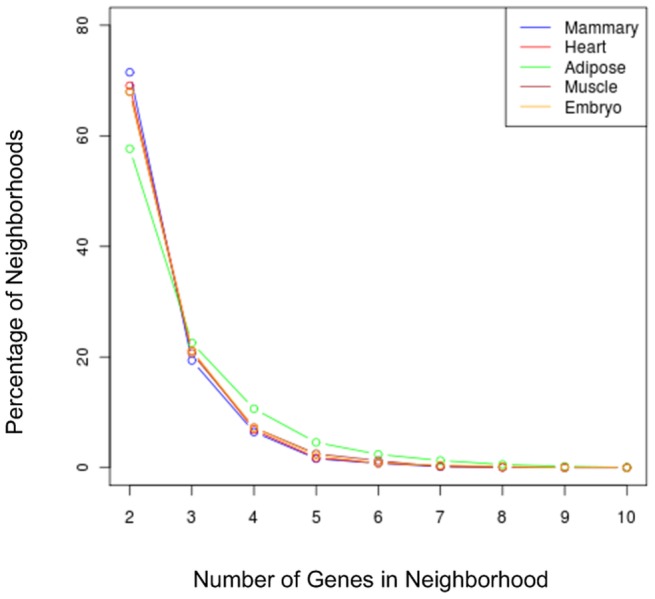
The x-axis is the number of genes in the neighborhood (defined here as adjacent genes co-expressed in the given tissue) and the y-axis is the relative percentage of neighborhoods with this size.