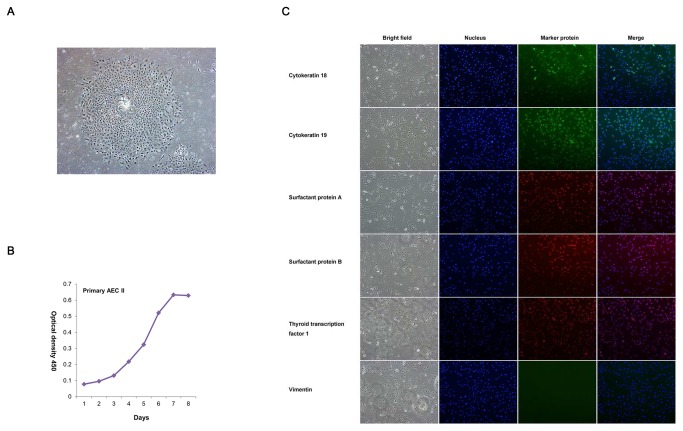
Figure 1. Isolation and immunofluorescence identification of AECs.
A: Primary culture of AECs (200× magnification). B: Cell proliferation curve of AECs at passage 3 as determined by the WST-1 method. C: Immunofluorescence identification of AECs. The cattle AEC line isolated was determined positive by immunofluorescence testing for cytokeratin CK18, CK19, SP-A, SP-B, and TTF-1 and negative for vimentin, which confirms its AEC characteristics.

